

Genome scan for loci regulating HDL cholesterol levels in Finnish extended pedigrees with early coronary heart disease
- PMID: 19935834
- PMCID: PMC2987327
- DOI: 10.1038/ejhg.2009.202
Genome scan for loci regulating HDL cholesterol levels in Finnish extended pedigrees with early coronary heart disease
Abstract
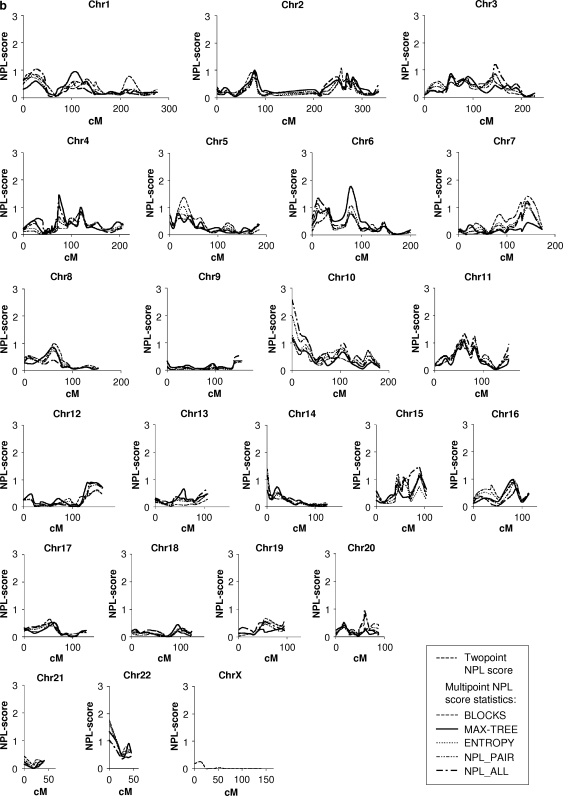
Coronary heart disease (CHD) is the leading cause of mortality in Western societies. Its risk is inversely correlated with plasma high-density lipoprotein cholesterol (HDL-C) levels, and approximately 50% of the variability in these levels is genetically determined. In this study, the aim was to carry out a whole-genome scan for the loci regulating plasma HDL-C levels in 35 well-defined Finnish extended pedigrees (375 members genotyped) with probands having low HDL-C levels and premature CHD. The additive genetic heritability of HDL-C was 43%. A variance component analysis revealed four suggestive quantitative trait loci (QTLs) for HDL-C levels, with the highest LOD score, 3.1, at the chromosomal locus 4p12. Other suggestive LOD scores were 2.1 at 2q33, 2.1 at 6p24 and 2.0 at 17q25. Three suggestive loci for the qualitative low HDL-C trait were found, with a nonparametric multipoint score of 2.6 at the chromosomal locus 10p15.3, 2.5 at 22q11 and 2.1 at 6p12. After correction for statin use, the strongest evidence of linkage was shown on chromosomes 4p12, 6p24, 6p12, 15q22 and 22q11. To search for the underlying gene on chromosome 6, we analyzed two functional and positional candidate genes (peroxisome proliferator-activated receptor-delta (PPARD), and retinoid X receptor beta, (RXRB)), but found no significant evidence of association. In conclusion, we identified seven chromosomal regions for HDL-C regulation exceeding the level for suggestive evidence of linkage.
Figures
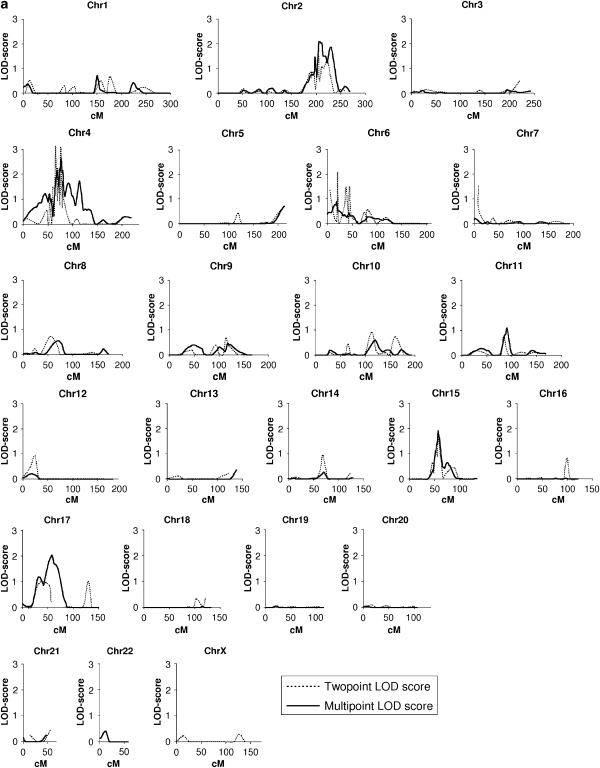
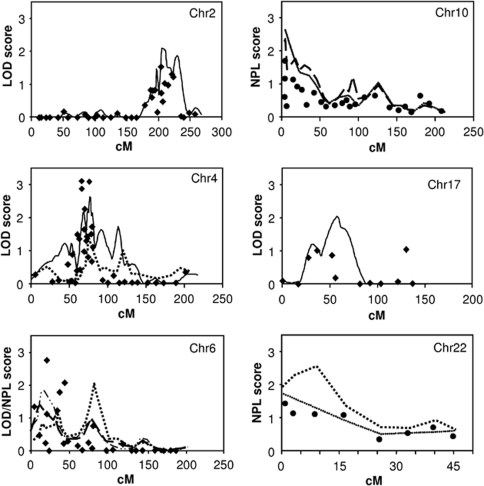
 , quantitative multipoint analysis;
  , qualitative multipoint analysis, NPL_ALL
 ; The same analysis in the initial scan (no additional markers);
  qualitative multipoint analysis, MAX-TREE;
  , qualitative multipoint analysis with overweight (BMI>25) subjects with low HDL-C coded as affected, NPL-ALL;
  , quantitative two-point analysis with sex, age and BMI (for Chr6) as covariates;
  , qualitative two-point analysis.
Similar articles
-
A genome-wide linkage scan identifies multiple quantitative trait loci for HDL-cholesterol levels in families with premature CAD and MI.J Lipid Res. 2010 Jun;51(6):1442-51. doi: 10.1194/jlr.M004325. Epub 2010 Jan 14. J Lipid Res. 2010. PMID: 20075193 Free PMC article.
-
A genome-wide scan for coronary heart disease suggests in Indo-Mauritians a susceptibility locus on chromosome 16p13 and replicates linkage with the metabolic syndrome on 3q27.Hum Mol Genet. 2001 Nov 15;10(24):2751-65. doi: 10.1093/hmg/10.24.2751. Hum Mol Genet. 2001. PMID: 11734540
-
Genome scans provide evidence for low-HDL-C loci on chromosomes 8q23, 16q24.1-24.2, and 20q13.11 in Finnish families.Am J Hum Genet. 2002 May;70(5):1333-40. doi: 10.1086/339988. Epub 2002 Mar 12. Am J Hum Genet. 2002. PMID: 11891617 Free PMC article.
-
HDL Cholesterol Metabolism and the Risk of CHD: New Insights from Human Genetics.Curr Cardiol Rep. 2017 Nov 4;19(12):132. doi: 10.1007/s11886-017-0940-0. Curr Cardiol Rep. 2017. PMID: 29103089 Review.
-
Genetics of cholesterol efflux.Curr Atheroscler Rep. 2012 Jun;14(3):235-46. doi: 10.1007/s11883-012-0247-y. Curr Atheroscler Rep. 2012. PMID: 22528521 Review.
Cited by
-
Sex-specific association of rs16996148 SNP in the NCAN/CILP2/PBX4 and serum lipid levels in the Mulao and Han populations.Lipids Health Dis. 2011 Dec 31;10:248. doi: 10.1186/1476-511X-10-248. Lipids Health Dis. 2011. PMID: 22208664 Free PMC article.
References
-
- Gordon T, Castelli WP, Hjortland MC, Kannel WB, Dawber TR. High density lipoprotein as a protective factor against coronary heart disease. The Framingham Study. Am J Med. 1977;5:707–714. - PubMed
-
- Genest JJ, Jr, Martin-Munley SS, McNamara JR, et al. Familial lipoprotein disorders in patients with premature coronary artery disease. Circulation. 1992;6:2025–2033. - PubMed
-
- Wang X, Paigen B. Genetics of variation in HDL cholesterol in humans and mice. Circ Res. 2005;1:27–42. - PubMed
-
- Kullo IJ, Turner ST, Boerwinkle E, Kardia SL, de AM. A novel quantitative trait locus on chromosome 1 with pleiotropic effects on HDL-cholesterol and LDL particle size in hypertensive sibships. Am J Hypertens. 2005;8:1084–1090. - PubMed
Publication types
MeSH terms
Substances
LinkOut - more resources
Full Text Sources
Medical
