

Increased neuronal nitric oxide synthase activity in retinal neurons in early diabetic retinopathy
- PMID: 19936028
- PMCID: PMC2776346
Increased neuronal nitric oxide synthase activity in retinal neurons in early diabetic retinopathy
Abstract
Purpose: There are increased levels of nitric oxide (NO) in diabetic retinas. The purpose of this study was to determine the extent that neuronal nitric oxide synthase (nNOS) contributes to the increased levels of retinal NO in early diabetic retinopathy by examining the expression and activity of nNOS in retinal neurons after 5 weeks of diabetes.
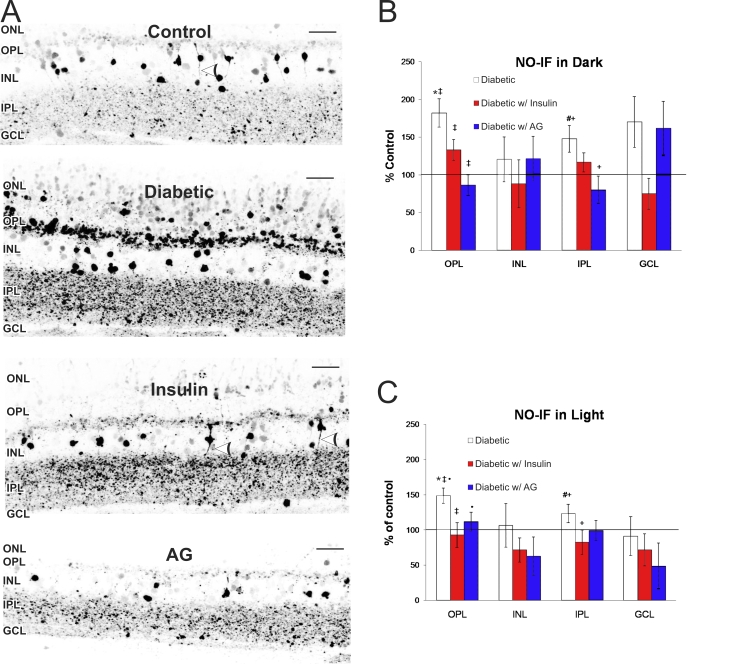
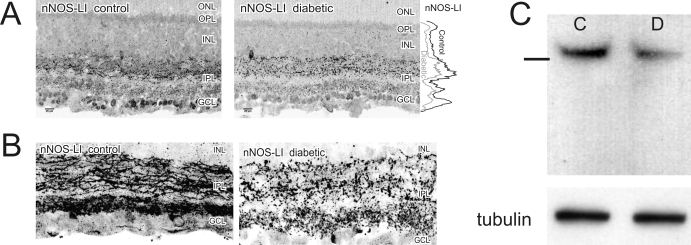
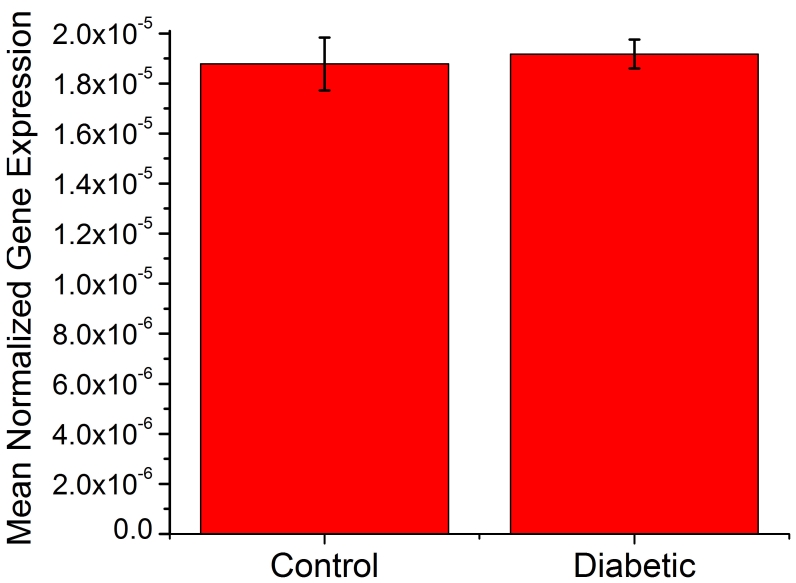
Methods: Changes in NO levels were measured using NO imaging of retinal neurons in mice with streptozotocin-induced diabetes for five weeks. NO imaging was compared to nNOS localization using immunocytochemistry, and nNOS message and protein levels were measured using quantitative real-time PCR and western blots.
Results: There was a close anatomic correlation between the localization of the increased NO production and the nNOS immunoreactivity in the retinal plexiform layers of diabetic retinas. There was no change in nNOS message, but nNOS protein was decreased and its subcellular localization was altered. Treatment with insulin or aminoguanidine partially ameliorated the increase in NO in diabetic retinas.
Conclusions: These results suggest that increased nNOS activity is responsible for the majority of increased NO in retinal neurons in early diabetic retinopathy. This supports a role for increased nNOS activity in the early neuronal dysfunction in the diabetic retina.
Figures
Similar articles
-
Depletion of nitric oxide synthase-containing neurons in the diabetic retina: reversal by aminoguanidine.Diabetologia. 1998 Dec;41(12):1419-25. doi: 10.1007/s001250051087. Diabetologia. 1998. PMID: 9867208
-
Up-regulated expression of neuronal nitric oxide synthase in experimental diabetic retina.Neurobiol Dis. 2006 Jan;21(1):43-9. doi: 10.1016/j.nbd.2005.06.007. Epub 2005 Jul 14. Neurobiol Dis. 2006. PMID: 16023354
-
Contribution of nitric oxide synthase isoforms to cholinergic vasodilation in murine retinal arterioles.Exp Eye Res. 2013 Apr;109:60-6. doi: 10.1016/j.exer.2013.01.012. Epub 2013 Feb 19. Exp Eye Res. 2013. PMID: 23434456
-
Inducible nitric oxide synthase isoform is a key mediator of leukostasis and blood-retinal barrier breakdown in diabetic retinopathy.Invest Ophthalmol Vis Sci. 2007 Nov;48(11):5257-65. doi: 10.1167/iovs.07-0112. Invest Ophthalmol Vis Sci. 2007. PMID: 17962481
-
Gender bias in gastroparesis: is nitric oxide the answer?Dig Dis Sci. 2011 Sep;56(9):2520-7. doi: 10.1007/s10620-011-1735-6. Epub 2011 May 11. Dig Dis Sci. 2011. PMID: 21559738 Free PMC article. Review.
Cited by
-
Altered expression of nNOS/NIDD in the retina of a glaucoma model of DBA/2J mice and the intervention by nNOS inhibition.J Mol Neurosci. 2013 Sep;51(1):47-56. doi: 10.1007/s12031-012-9943-x. Epub 2013 Jan 9. J Mol Neurosci. 2013. PMID: 23297011
-
Animal models of diabetic retinopathy: summary and comparison.J Diabetes Res. 2013;2013:106594. doi: 10.1155/2013/106594. Epub 2013 Oct 27. J Diabetes Res. 2013. PMID: 24286086 Free PMC article. Review.
-
Triamcinolone acetonide combined with aminoguanidine inhibits inflammation and oxidative stress, improves vascular endothelial and retinal function and reduces VEGF expression in diabetic retinopathy patients.Exp Ther Med. 2020 Apr;19(4):2519-2526. doi: 10.3892/etm.2020.8478. Epub 2020 Jan 30. Exp Ther Med. 2020. PMID: 32256730 Free PMC article.
-
Critical role of TXNIP in oxidative stress, DNA damage and retinal pericyte apoptosis under high glucose: implications for diabetic retinopathy.Exp Cell Res. 2013 Apr 15;319(7):1001-12. doi: 10.1016/j.yexcr.2013.01.012. Epub 2013 Jan 24. Exp Cell Res. 2013. PMID: 23353834 Free PMC article.
-
Circulating miRNAs as a Predictive Biomarker of the Progression from Prediabetes to Diabetes: Outcomes of a 5-Year Prospective Observational Study.J Clin Med. 2020 Jul 10;9(7):2184. doi: 10.3390/jcm9072184. J Clin Med. 2020. PMID: 32664305 Free PMC article.
References
-
- Aiello LM. Perspectives on diabetic retinopathy. Am J Ophthalmol. 2003;136:122–35. - PubMed
-
- Antonetti DA, Barber AJ, Bronson SK, Freeman WM, Gardner TW, Jefferson LS, Kester M, Kimball SR, Krady JK, LaNoue KF, Norbury CC, Quinn PG, Sandirasegarane L, Simpson IA, JDRF Diabetic Retinopathy Center Group. Diabetic retinopathy: seeing beyond glucose-induced microvascular disease. Diabetes. 2006;55:2401–11. - PubMed
-
- Lieth E, Gardner TW, Barber AJ, Antonetti DA. Retinal neurodegeneration: early pathology in diabetes. Clin Experiment Ophthalmol. 2000;28:3–8. - PubMed
-
- Barber AJ. A new view of diabetic retinopathy: a neurodegenerative disease of the eye. Prog Neuropsychopharmacol Biol Psychiatry. 2003;27:283–90. - PubMed
-
- Lieth E, Gardner TW, Barber AJ, Antonetti DA. Retinal neurodegeneration: early pathology in diabetes. Clin Experiment Ophthalmol. 2000;28:3–8. - PubMed
Publication types
MeSH terms
Substances
Grants and funding
LinkOut - more resources
Full Text Sources
Medical