

A novel extended Granger Causal Model approach demonstrates brain hemispheric differences during face recognition learning
- PMID: 19936225
- PMCID: PMC2777405
- DOI: 10.1371/journal.pcbi.1000570
A novel extended Granger Causal Model approach demonstrates brain hemispheric differences during face recognition learning
Abstract
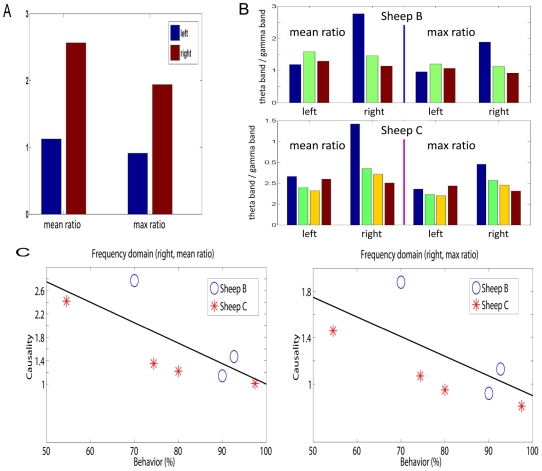
Two main approaches in exploring causal relationships in biological systems using time-series data are the application of Dynamic Causal model (DCM) and Granger Causal model (GCM). These have been extensively applied to brain imaging data and are also readily applicable to a wide range of temporal changes involving genes, proteins or metabolic pathways. However, these two approaches have always been considered to be radically different from each other and therefore used independently. Here we present a novel approach which is an extension of Granger Causal model and also shares the features of the bilinear approximation of Dynamic Causal model. We have first tested the efficacy of the extended GCM by applying it extensively in toy models in both time and frequency domains and then applied it to local field potential recording data collected from in vivo multi-electrode array experiments. We demonstrate face discrimination learning-induced changes in inter- and intra-hemispheric connectivity and in the hemispheric predominance of theta and gamma frequency oscillations in sheep inferotemporal cortex. The results provide the first evidence for connectivity changes between and within left and right inferotemporal cortexes as a result of face recognition learning.
Conflict of interest statement
The authors have declared that no competing interests exist.
Figures
 ,
,  , and
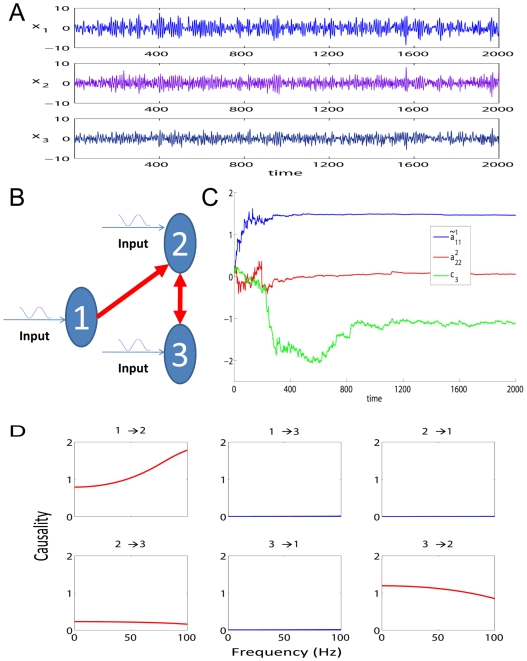
, and  for the simulated data in Toy Model 1. The initial values of the three parameters are all set to 0. The covariance matrix
  is first set to decay slowly to achieve faster convergence and then set to decay faster after two hundred time points to ensure a better accuracy. D. Frequency decomposition of all kinds of relationships between the state variables. Significant causal influences are marked by red.
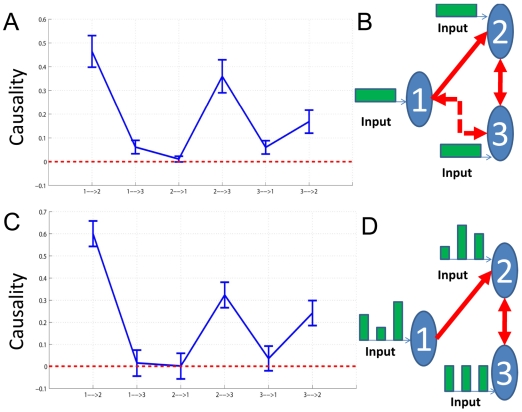
 (without input) in our algorithms and a traditional VAR(10) model to detect the causal influence. B. The network structure of the state variables corresponding to A. Two additional causal relationships are marked by the dashed line. C. Confidence intervals of all links between units. The data is generated with Eq. (16) where
  and
and  ,
,  are generated with normal distribution (with input). D. The network structure of the state variables corresponding to C.
References
-
- Cantone I, Marucci L, Iorio F, Ricci M, Belcastro V, et al. A yeast synthetic network for in vivo assessment of reverse-engineering and modeling approaches. Cell. 2009;137:172–181. - PubMed
-
- Camacho D, Collins J. Systems biology strikes gold. Cell. 2009;137:24–26. - PubMed
-
- Zou C, Kendrick KM, Feng J. The fourth way: Granger causality is better than the three other reverse-engineering approaches. 2009. Cell http://www.cell.com/comments/S0092-8674(09)00156-1.
Publication types
MeSH terms
Grants and funding
LinkOut - more resources
Full Text Sources
