

Genome-wide scan for signatures of human population differentiation and their relationship with natural selection, functional pathways and diseases
- PMID: 19936260
- PMCID: PMC2775949
- DOI: 10.1371/journal.pone.0007927
Genome-wide scan for signatures of human population differentiation and their relationship with natural selection, functional pathways and diseases
Abstract
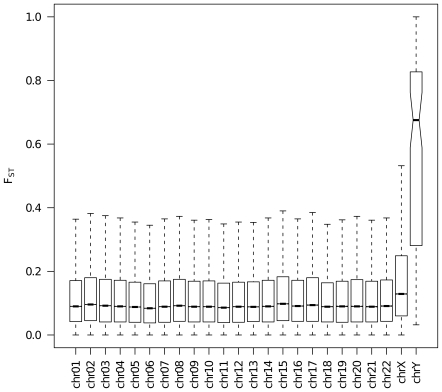
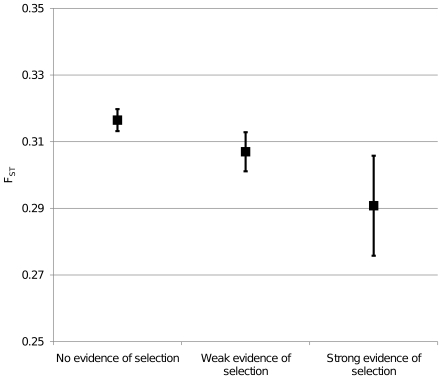
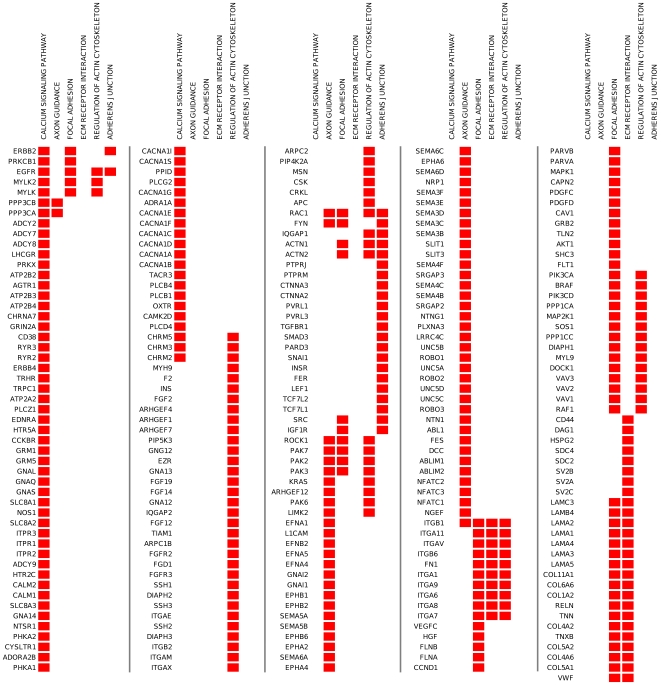
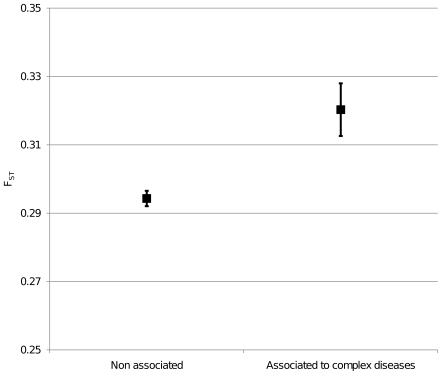
Genetic differences both between individuals and populations are studied for their evolutionary relevance and for their potential medical applications. Most of the genetic differentiation among populations are caused by random drift that should affect all loci across the genome in a similar manner. When a locus shows extraordinary high or low levels of population differentiation, this may be interpreted as evidence for natural selection. The most used measure of population differentiation was devised by Wright and is known as fixation index, or F(ST). We performed a genome-wide estimation of F(ST) on about 4 millions of SNPs from HapMap project data. We demonstrated a heterogeneous distribution of F(ST) values between autosomes and heterochromosomes. When we compared the F(ST) values obtained in this study with another evolutionary measure obtained by comparative interspecific approach, we found that genes under positive selection appeared to show low levels of population differentiation. We applied a gene set approach, widely used for microarray data analysis, to detect functional pathways under selection. We found that one pathway related to antigen processing and presentation showed low levels of F(ST), while several pathways related to cell signalling, growth and morphogenesis showed high F(ST) values. Finally, we detected a signature of selection within genes associated with human complex diseases. These results can help to identify which process occurred during human evolution and adaptation to different environments. They also support the hypothesis that common diseases could have a genetic background shaped by human evolution.
Conflict of interest statement
Figures


References
-
- Cavalli-Sforza LL, Menozzi P, Piazza A. Princeton: Princeton University Press; 1996. The History and Geography of Human Genes.
-
- Barbujani G, Goldstein DB. Africans and Asians abroad: genetic diversity in Europe. Annu Rev Genomics Hum Genet. 2004;5:119–150. doi: 10.1146/annurev.genom.5.061903.180021. - DOI - PubMed
-
- Kimura M. Cambridge: Cambridge University Press; 1985. The Neutral Theory of Molecular Evolution.
-
- Akey JM, Zhang G, Zhang K, Jin L, Shriver MD. Interrogating a high-density SNP map for signatures of natural selection. Genome Res. 2002;12:1805–1814. doi: 10.1101/gr.631202. - DOI - PMC - PubMed
-
- Bamshad M, Wooding SP. Signatures of natural selection in the human genome. Nat Rev Genet. 2003;4:99–111. doi: 10.1038/nrg999. - DOI - PubMed
Publication types
MeSH terms
Substances
LinkOut - more resources
Full Text Sources
Miscellaneous
