

Mu transposon insertion sites and meiotic recombination events co-localize with epigenetic marks for open chromatin across the maize genome
- PMID: 19936291
- PMCID: PMC2774946
- DOI: 10.1371/journal.pgen.1000733
Mu transposon insertion sites and meiotic recombination events co-localize with epigenetic marks for open chromatin across the maize genome
Abstract
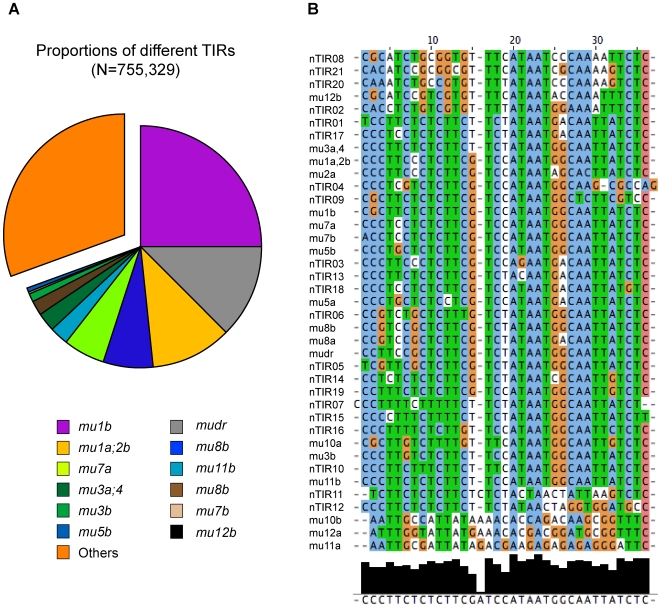
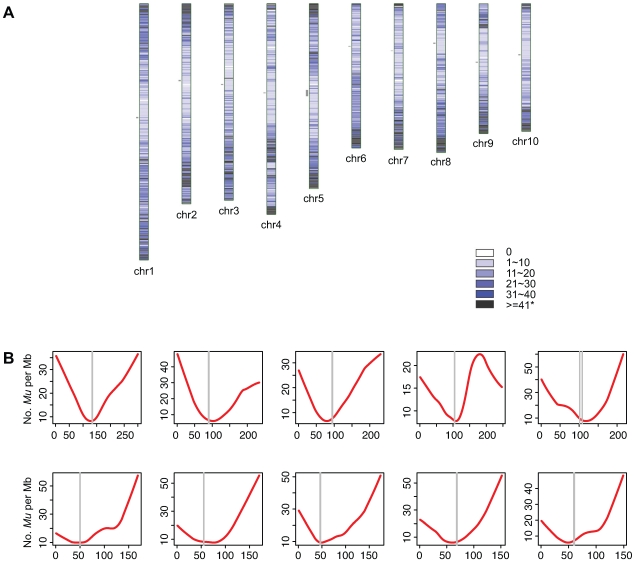
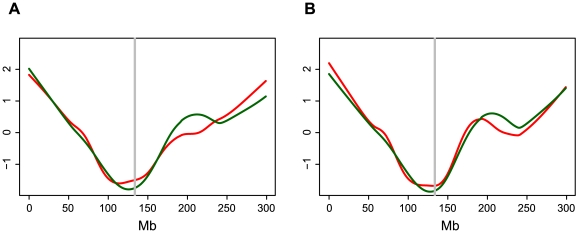
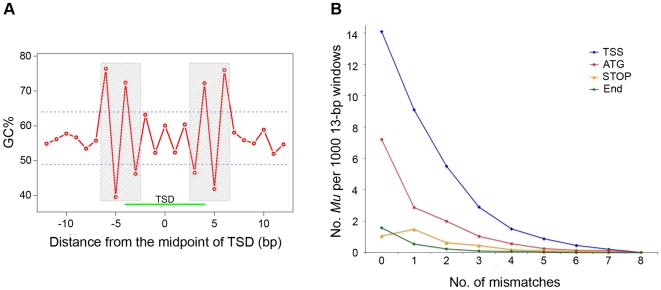
The Mu transposon system of maize is highly active, with each of the approximately 50-100 copies transposing on average once each generation. The approximately one dozen distinct Mu transposons contain highly similar approximately 215 bp terminal inverted repeats (TIRs) and generate 9-bp target site duplications (TSDs) upon insertion. Using a novel genome walking strategy that uses these conserved TIRs as primer binding sites, Mu insertion sites were amplified from Mu stocks and sequenced via 454 technology. 94% of approximately 965,000 reads carried Mu TIRs, demonstrating the specificity of this strategy. Among these TIRs, 21 novel Mu TIRs were discovered, revealing additional complexity of the Mu transposon system. The distribution of >40,000 non-redundant Mu insertion sites was strikingly non-uniform, such that rates increased in proportion to distance from the centromere. An identified putative Mu transposase binding consensus site does not explain this non-uniformity. An integrated genetic map containing more than 10,000 genetic markers was constructed and aligned to the sequence of the maize reference genome. Recombination rates (cM/Mb) are also strikingly non-uniform, with rates increasing in proportion to distance from the centromere. Mu insertion site frequencies are strongly correlated with recombination rates. Gene density does not fully explain the chromosomal distribution of Mu insertion and recombination sites, because pronounced preferences for the distal portion of chromosome are still observed even after accounting for gene density. The similarity of the distributions of Mu insertions and meiotic recombination sites suggests that common features, such as chromatin structure, are involved in site selection for both Mu insertion and meiotic recombination. The finding that Mu insertions and meiotic recombination sites both concentrate in genomic regions marked with epigenetic marks of open chromatin provides support for the hypothesis that open chromatin enhances rates of both Mu insertion and meiotic recombination.
Conflict of interest statement
The authors have declared that no competing interests exist.
Figures

Similar articles
-
MuDR transposase increases the frequency of meiotic crossovers in the vicinity of a Mu insertion in the maize a1 gene.Genetics. 2005 Feb;169(2):917-29. doi: 10.1534/genetics.104.035089. Epub 2004 Oct 16. Genetics. 2005. PMID: 15489518 Free PMC article.
-
Independent evolution of transposase and TIRs facilitated by recombination between Mutator transposons from divergent clades in maize.Proc Natl Acad Sci U S A. 2023 Aug;120(31):e2305298120. doi: 10.1073/pnas.2305298120. Epub 2023 Jul 25. Proc Natl Acad Sci U S A. 2023. PMID: 37490540 Free PMC article.
-
Maize Mu transposons are targeted to the 5' untranslated region of the gl8 gene and sequences flanking Mu target-site duplications exhibit nonrandom nucleotide composition throughout the genome.Genetics. 2002 Feb;160(2):697-716. doi: 10.1093/genetics/160.2.697. Genetics. 2002. PMID: 11861572 Free PMC article.
-
Saturation mutagenesis using maize transposons.Curr Opin Plant Biol. 2000 Apr;3(2):103-7. doi: 10.1016/s1369-5266(99)00051-5. Curr Opin Plant Biol. 2000. PMID: 10712955 Review.
-
The maize abnormal chromosome 10 meiotic drive haplotype: a review.Chromosome Res. 2022 Sep;30(2-3):205-216. doi: 10.1007/s10577-022-09693-6. Epub 2022 Jun 2. Chromosome Res. 2022. PMID: 35652970 Review.
Cited by
-
eQTL mapping of transposon silencing reveals a position-dependent stable escape from epigenetic silencing and transposition of AtMu1 in the Arabidopsis lineage.Plant Cell. 2014 Aug;26(8):3261-71. doi: 10.1105/tpc.114.128512. Epub 2014 Aug 5. Plant Cell. 2014. PMID: 25096782 Free PMC article.
-
Genome walking by next generation sequencing approaches.Biology (Basel). 2012 Oct 1;1(3):495-507. doi: 10.3390/biology1030495. Biology (Basel). 2012. PMID: 24832505 Free PMC article.
-
MaizeGDB update: new tools, data and interface for the maize model organism database.Nucleic Acids Res. 2016 Jan 4;44(D1):D1195-201. doi: 10.1093/nar/gkv1007. Epub 2015 Oct 1. Nucleic Acids Res. 2016. PMID: 26432828 Free PMC article.
-
Mechanisms of DNA Transposition.Microbiol Spectr. 2015 Apr;3(2):MDNA3-0034-2014. doi: 10.1128/microbiolspec.MDNA3-0034-2014. Microbiol Spectr. 2015. PMID: 26104718 Free PMC article. Review.
-
Development of pachytene FISH maps for six maize chromosomes and their integration with other maize maps for insights into genome structure variation.Chromosome Res. 2012 May;20(4):363-80. doi: 10.1007/s10577-012-9281-4. Epub 2012 May 16. Chromosome Res. 2012. PMID: 22588802 Free PMC article.
References
-
- Lisch D. Mutator transposons. Trends Plant Sci. 2002;7:498–504. - PubMed
-
- McCarty DR, Settles AM, Suzuki M, Tan BC, Latshaw S, et al. Steady-state transposon mutagenesis in inbred maize. Plant J. 2005;44:52–61. - PubMed
-
- Candela H, Hake S. The art and design of genetic screens: maize. Nat Rev Genet. 2008;9:192–203. - PubMed
-
- Brutnell TP. Transposon tagging in maize. Funct Integr Genomics. 2002;2:4–12. - PubMed
Publication types
MeSH terms
Substances
LinkOut - more resources
Full Text Sources
Other Literature Sources
Research Materials
Miscellaneous
