. 2009 Nov 17:15:2384-403.

Melatonin receptor expression in Xenopus laevis surface corneal epithelium: diurnal rhythm of lateral membrane localization

Affiliations

Melatonin receptor expression in Xenopus laevis surface corneal epithelium: diurnal rhythm of lateral membrane localization

Allan F Wiechmann et al. Mol Vis. .

Abstract

Purpose: Melatonin receptors are seven-pass G protein-coupled receptors located in many tissues throughout the body, including the corneal epithelium (CE), and relay circadian signals to the target cells. The purpose of this study was to determine more precisely the cellular distribution of the melatonin receptors in the surface cells of the CE of Xenopus laevis, and to examine the relative distribution of melatonin receptor subtype expression at different times during the circadian cycle.

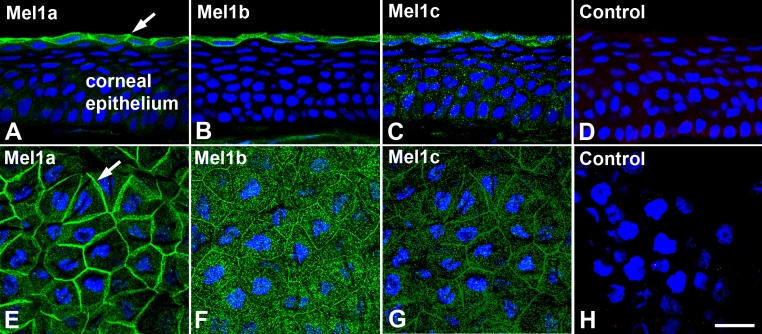
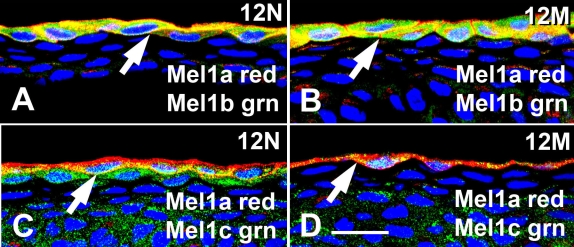
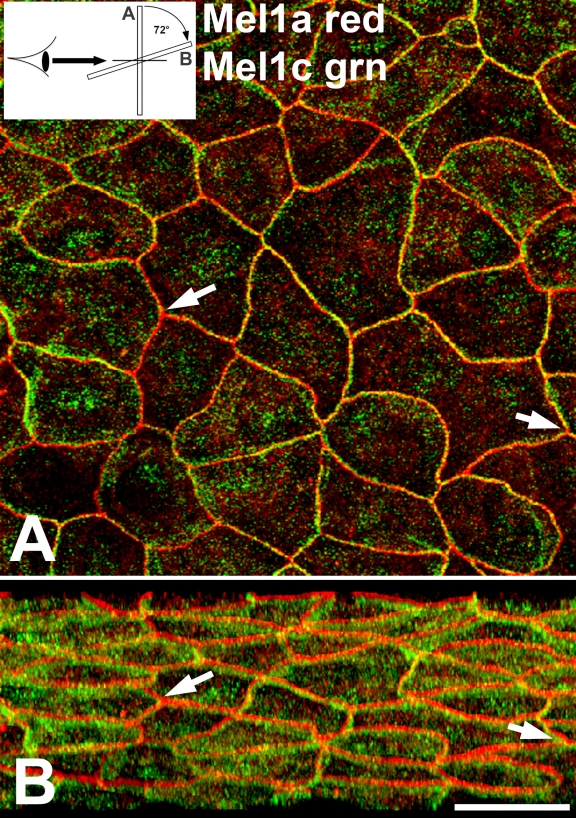
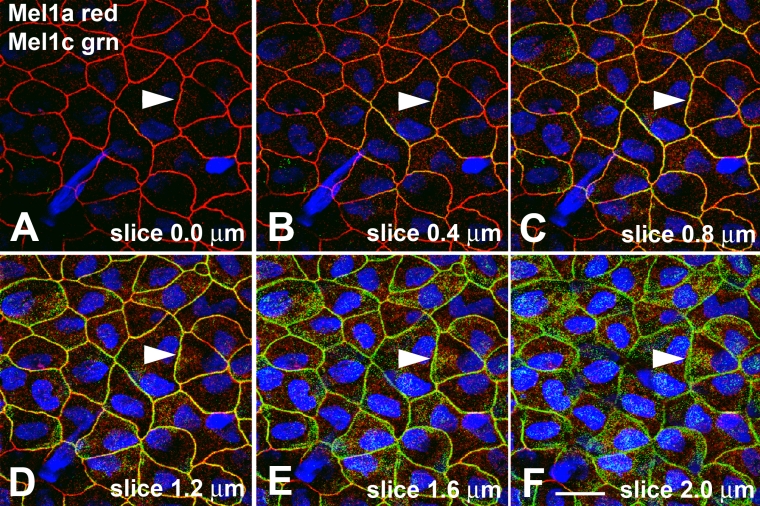
Methods: Cryostat sections and whole corneas of adult Xenopus laevis were processed for immunocytochemistry using antibodies specific for each of the three melatonin receptor subtypes (Mel1a, Mel1b, and Mel1c). For the circadian studies, corneas were obtained from euthanized frogs at 4-h intervals during a 24-h period under a 12 h:12 h light-dark cycle. Double-label immunocytochemistry was performed using a Mel1a antibody in combination with antibodies against Mel1b, Mel1c, or the zonula occludens protein ZO-1. Corneal whole-mount specimens and corneal sections were analyzed by laser-scanning confocal microscopy.

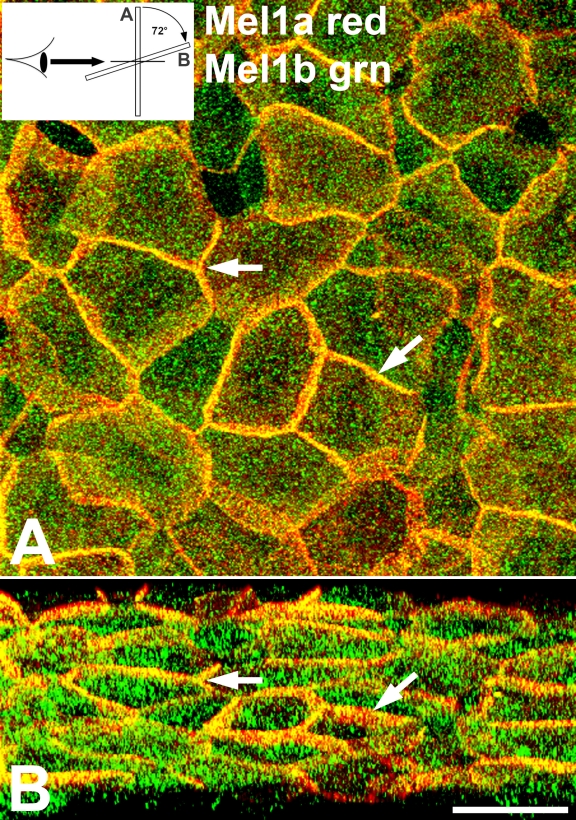
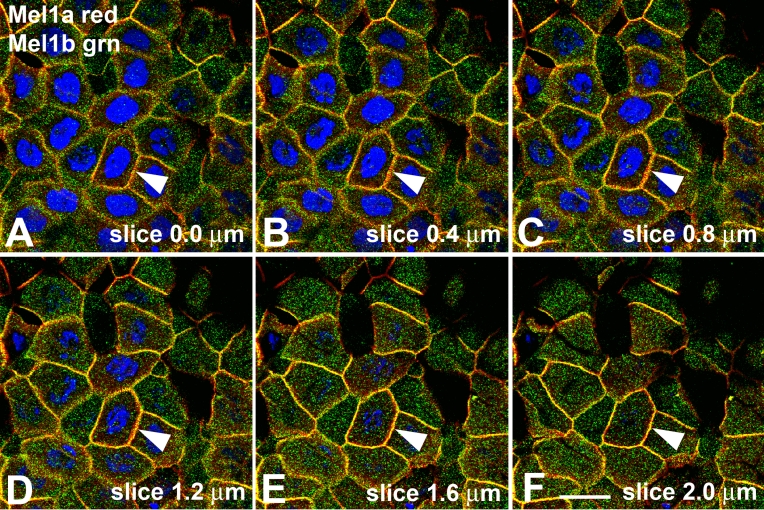
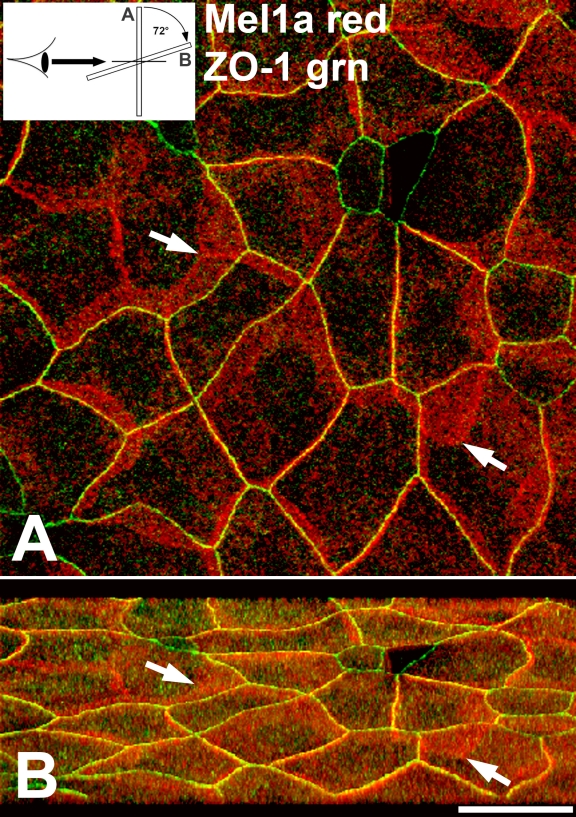
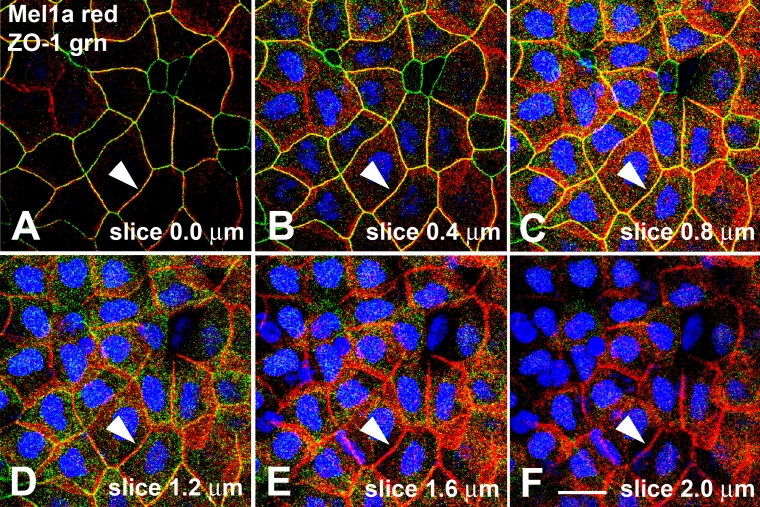
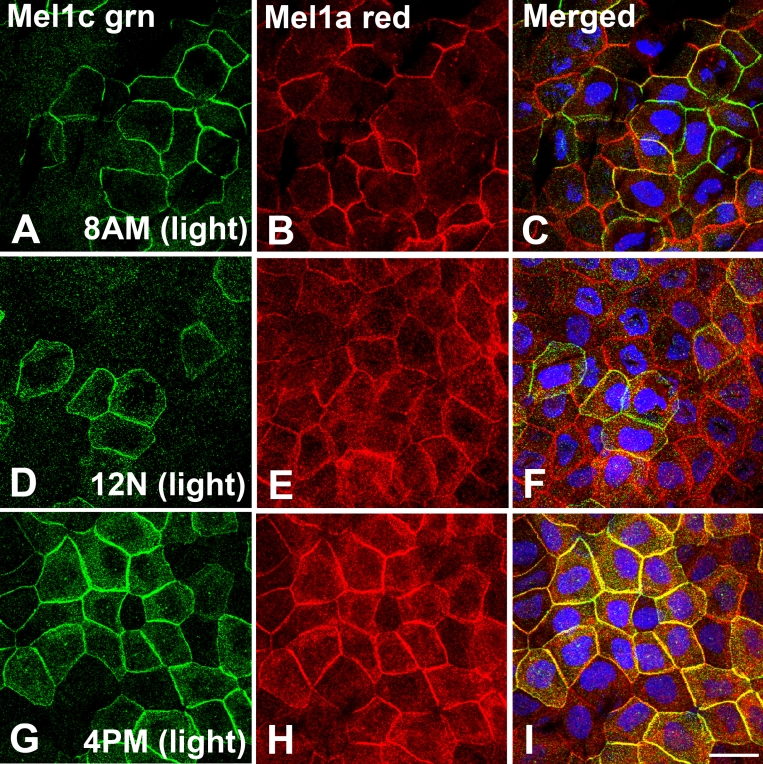
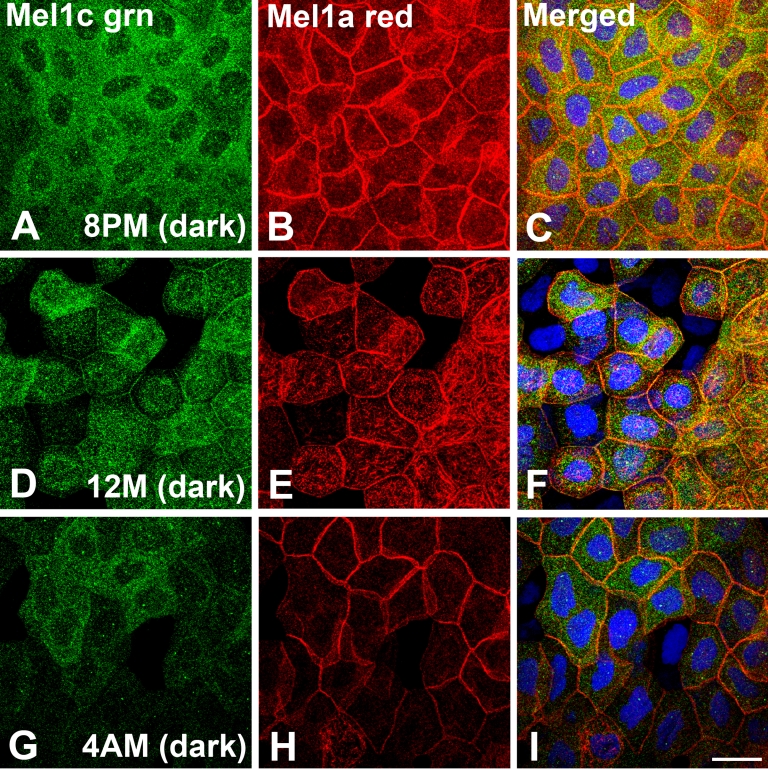
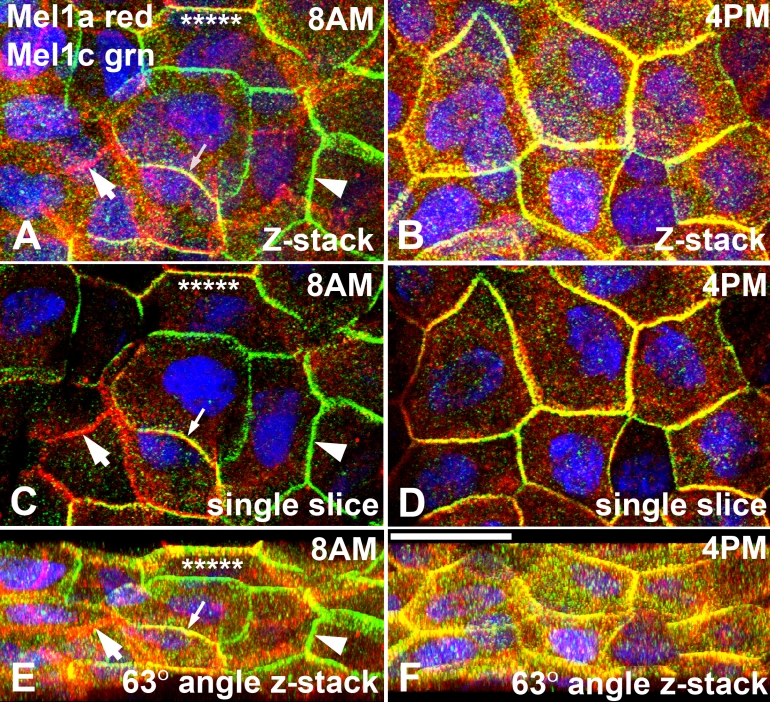
Results: All three melatonin receptor subtypes were expressed on the surface and sub-superficial layer of CE cells, but with different sub-cellular distributions. The Mel1a receptor was highly localized to the lateral plasma membrane of the surface CE, but also displayed cytoplasmic localization at some times of day, especially at night. Mel1c showed a similar pattern of labeling to Mel1a, but there were some distinctive differences, insofar as the Mel1c receptors were usually located immediately basal to the Mel1a receptors. The relative degree of membrane and cytoplasmic labeling of the Mel1c receptor also oscillated during the 24-h period, but was out of phase with the changes that occurred in the Mel1a receptor localization. Furthermore, in the late afternoon time point, the Mel1a and Mel1c receptors were highly co-localized, suggestive of heterodimerization, whereas at other time points, the two receptors were distinctly not co-localized. Double-label immunocytochemistry of Mel1a and ZO-1 demonstrated that the Mel1a receptor was located basal to the tight junctions, on the lateral membrane in very close proximity to the ZO-1 protein.

Conclusions: Mel1a, Mel1b, and Mel1c receptor subtypes are expressed in the lateral plasma membrane of the Xenopus surface CE, at a position in close proximity to the tight junctions that form the corneal diffusion barrier. The very close association of the Mel1a receptors to the ZO-1 peripheral membrane tight junction proteins is suggestive of a potential role for melatonin in influencing the rate of tight junction formation or breakdown. The transient co-localization of Mel1a and Mel1c late in the light period is suggestive of formation of heterodimers that may influence receptor responsiveness and/or activity during specific periods of the day. The dynamic daily changes in melatonin receptor subtype expression and localization in the surface CE supports the concept that melatonin signaling may affect circadian activities of the surface epithelium of the cornea.


Figures

Figure 1
Figure 1
Mel1a, Mel1b, and Mel1c immunocytochemistry of cryostat sections and whole mounts of Xenopus laevis corneal epithelium. A-C: Cryostat sections of corneas obtained during the light period were immunolabeled with Mel1a, Mel1b, or Mel1c receptor antibodies. Arrows in panel A indicate the immunolabeled plasma membranes of the surface epithelium. D: The control specimen was processed in the absence of primary antibody. E-G: Whole mount preparations of corneas obtained during the light period were immunolabeled with Mel1a, Mel1b, or Mel1c receptor antibodies. H: The control whole mount specimen was processed in the absence of primary antibody. Primary antibodies were labeled with secondary antibody conjugated to AlexaFluor 488 (green fluorescence). Most of the Mel1a receptor labeling (A and E) occurs in the lateral plasma membrane of the surface epithelium, whereas there is a higher proportion of Mel1b (B and F) and Mel1c (C and G) labeling also present in cytoplasmic compartments in addition to the lateral membranes. Note that no specific immunolabeling is detected in the control specimens (D and H). Nuclei are stained with DAPI. The magnification bar (H) represents 20 µm.
Figure 2
Figure 2
Mel1a, Mel1b, and Mel1c double-label immunocytochemistry of cryostat sections of Xenopus laevis corneal epithelium. A and C: Corneas obtained at 12:00 noon (12N) in the light. B and D: Corneas obtained at 12:00 midnight (12M) in the dark. Sections were immunolabeled with Mel1a and either Mel1b or Mel1c receptor antibodies. Mel1a labeling is represented in red, and Mel1b and Mel1c labeling is represented in green. Yellow indicates regions of co-localization of the red and green signal. Melatonin receptors are expressed in the surface epithelium, but their relative levels of expression and distribution change between 12N and 12M. Arrows indicate the immunolabeled plasma membranes of the surface epithelium. Nuclei are stained with DAPI. The magnification bar (D) represents 20 µm.
Figure 3
Figure 3
Confocal double-label immunocytochemical localization of Mel1a and Mel1c in Xenopus corneal whole mounts. A: The specimen shown was obtained in the mid-light period (12N). Both Mel1a and Mel1c immunolabeling is observed on the lateral plasma membrane, with some immunoreactivity also occurring in the cytoplasm. The labeling of the plasma membrane displays distinct areas of Mel1a (red), Mel1c (green), and both receptors (yellow). Arrows are provided as reference points to indicate the same points on B. The inset illustrates the 72° rotation on the x-axis of the image in A, indicating the orientation relative to the viewer’s eye in B. B: Three-dimensional reconstructions of confocal z-stacks of optical slices were rotated at 72° degrees on the x-axis to enable optimal viewing of the pattern of immunolabeling. The rotated image shows that the red Mel1a labeling is generally located apically to the green Mel1c labeling. The Mel1a labeling is seen as a relatively broad continuous band of red label on the lateral plasma membrane of the majority of surface CE cells. A somewhat broader band of green Mel1c labeling appears directly basal to the Mel1a label. Some yellow labeling is occasionally observed, indicating some co-localization of Mel1a and Mel1c. There are many areas in the red Mel1a band in which yellow labeling is interspersed between areas of red Mel1a labeling, suggesting that some green Mel1c-labeled receptor is interdigitated among the Mel1a-labeled receptor. The confocal images in both panels are comprised of 13 optical slices of 400 nm each in the z-series. The magnification bar (B) represents 20 µm.
Figure 4
Figure 4
Localization of Mel1a and Mel1c in progressive confocal optical slices of Xenopus corneal epithelium. A: Image of the most superficial surface of the surface corneal epithelium. Note that only the red Mel1a immunoreactivity is present on the lateral membranes. B-F: As the 0.4 µm slices progress deeper into the corneal epithelium layer, the Mel1a immunoreactivity lessens, whereas the green Mel1c immunoreactivity increases (note arrowheads indicating an example of this), indicating that the Mel1c receptor is located basal to the Mel1a receptor. Nuclei are stained with DAPI. The magnification bar (F) represents 20 µm.
Figure 5
Figure 5
Confocal double-label immunocytochemical localization of Mel1a and Mel1b in Xenopus corneal whole mounts. A: The specimen shown was obtained in the mid-light period (12N). Both Mel1a (red) and Mel1b (green) immunolabeling is present on the lateral plasma membrane appearing mostly as the merged yellow fluorescence indicative of co-localization. A significant amount of green Mel1b immunoreactivity is also present in the cytoplasm. Arrows are provided as reference points to indicate the same points on panel B. The inset illustrates the 72° rotation on the x-axis of the image in A, indicating the orientation relative to the viewer’s eye in B. B: Three-dimensional reconstructions of confocal z-stacks of optical slices were rotated at 72° degrees on the x-axis to enable optimal viewing of the pattern of immunolabeling. The rotated image shows that the Mel1a-Mel1b-labeled cells are characterized by a broad band of merged yellow labeling, interdigitating with a lesser amount of red Mel1a labeling. This pattern of labeling suggests that a majority of Mel1a and Mel1b receptors are located in very close proximity to each other on the lateral membrane. The confocal images in both panels are comprised of 19 optical slices of 400 nm each in the z-series. The magnification bar (B) represents 20 µm.
Figure 6
Figure 6
Localization of Mel1a and Mel1b in progressive confocal optical slices of Xenopus corneal epithelium. A: Image of the most superficial surface of the surface corneal epithelium. Note the predominance of yellow (merged red and green) labeling of most lateral membranes, with a lesser amount of interdigitated red Mel1a labeling (note arrowheads indicating an example of this). B-F: As the 0.4-µm slices progress deeper into the corneal epithelium layer , there is not a transition from red to green labeling as was seen with Mel1a-Mel1c, but instead the predominance of yellow labeling with some interspersed red labeling is maintained throughout all slices. Nuclei are stained with DAPI. The magnification bar (F) represents 20 µm.
Figure 7
Figure 7
Confocal double-label immunocytochemical localization of Mel1a and ZO-1 in Xenopus corneal whole mounts. A: Mel1a and ZO-1 immunolabeling is observed on the lateral plasma membrane, with some immunoreactivity also occurring in the cytoplasm. Mel1a (red) labeling is present predominantly as very broad bands on the lateral membranes, including the obliquely-oriented lateral membranes (arrows). The plasma membrane has an abundance of yellow labeling, indicative of a very close proximity of red Mel1a and green ZO-1. The ZO-1 labeling was not as broadly distributed on the lateral membrane. The inset illustrates the 72° rotation on the x-axis of the image in A, indicating the orientation relative to the viewer’s eye in B. B: Three-dimensional reconstructions of confocal z-stacks of optical slices were rotated at 72° degrees on the x-axis to enable optimal viewing of the pattern of immunolabeling. Arrows are provided as reference points to indicate the same points on panel A. The rotated image shows that the green ZO-1 labeling is generally located apically to the red Mel1a labeling. The ZO-1 labeling appears as a relatively narrow continuous band of green labeling on the lateral plasma membrane, whereas a much broader band of red Mel1a labeling appears directly basal to the ZO-1 label. Significant yellow labeling is observed, indicating that the Mel1a receptor is in very close proximity to ZO-1. The confocal images in both panels are comprised of seven optical slices of 400 nm each in the z-series. The magnification bar (B) represents 20 µm.
Figure 8
Figure 8
Localization of ZO-1 and Mel1a in progressive confocal optical slices of Xenopus corneal epithelium. A: Image of the most superficial surface of the surface corneal epithelium. In the most apical slice (slice 0.0 µm), red Mel1a, green ZO-1, and merged yellow labeling is observed in variable amounts on different cell membranes. B-F: As the 0.4-µm slices progress deeper into the corneal epithelium layer, the green ZO-1 immunoreactivity gradually lessens, whereas the red Mel1a immunoreactivity increases (note arrowheads indicating an example of this), indicating that the Mel1a receptor is located basal to the zonula adherens, but is in very close proximity in most of the slices (A-C). Nuclei are stained with DAPI. The magnification bar (F) represents 20 µm.
Figure 9
Figure 9
Mel1a and Mel1c immunocytochemistry of whole-mounted Xenopus laevis surface corneal epithelium obtained at 4-h intervals during a 24-h light–dark cycle. Frogs were housed under a 12 h:12 h light–dark cycle (6:00 AM: lights on; 6:00 PM: lights off). All tissues in this figure were obtained in the light. Mel1c labeling is represented in green (A, D, and G) and Mel1a labeling is represented in red (B, E, and H). The yellow labeling in the merged images (C, F, and I) indicates regions of co-localization of the red and green signal. A-C: Corneas obtained at 8:00 AM (2 h after lights on). Mel1c and Mel1a labeling is localized to the lateral plasma membrane of different yet overlapping subpopulations of cells. D-F: Corneas obtained at 12:00 N (mid-light). Mel1a and Mel1c immunolabeling is present on the lateral membranes of different populations of CE cells, with some minor regions of overlap. G-I: Corneas obtained at 4:00 PM (2 h before lights off). Most of the Mel1a and Mel1c immunolabeling is co-localized on the lateral membranes, with some cytoplasmic labeling that is not co-localized. Nuclei are stained with DAPI. The confocal images in all panels are comprised of three optical slices of 400 nm each in the z-series. The magnification bar (I) represents 20 µm.
Figure 10
Figure 10
Mel1a and Mel1c immunocytochemistry of whole-mounted Xenopus laevis surface corneal epithelium obtained at 4-h intervals during a 24-h light–dark cycle. Frogs were housed under a 12 h:12 h light–dark cycle (6:00 AM: lights on; 6:00 PM: lights off). All tissues in this figure were obtained in the dark. Mel1c labeling is represented in green (A, D, and G) and Mel1a labeling is represented in red (B, E, and H). The yellow labeling in the merged images (C, F, and I) indicates regions of co-localization of the red and green signal. A-C: Corneas obtained at 8:00 PM (2 h after lights off). Mel1c immunolabeling is almost exclusively located in the cytoplasm, but there is intense Mel1a immunoreactivity present in the lateral membranes, and also in the cytoplasm. The cytoplasmic immunolabeling of Mel1a and Mel1c is not co-localized. D-F: Corneas obtained at 12:00 M (mid-dark). Most of the Mel1c immunoreactivity is in the cytoplasm, although some lateral membrane labeling is also detected. Mel1a immunoreactivity is predominant in the lateral membranes, but there are many irregular-appearing cytoplasmic compartments that express Mel1a immunoreactivity, and they do not co-localize with the Mel1c cytoplasmic labeling. Essentially, all Mel1c lateral membrane labeling is co-localized with Mel1a membrane labeling. G-I: Corneas obtained at 4:00 AM (2 h before lights on). Most of the Mel1c immunoreactivity is located in the cytoplasm, with very little membrane labeling detected. Most of the Mel1a immunoreactivity is located on the lateral membranes, with some immunoreactivity also appearing in irregular cytoplasmic compartments. The Mel1a and Mel1c cytoplasmic labeling is not co-localized. Nuclei are stained with DAPI. The confocal images in all panels are comprised of three optical slices of 400 nm each in the z-series. The magnification bar (I) represents 20 µm.
Figure 11
Figure 11
Confocal analysis of Mel1a and Mel1c immunocytochemistry of whole-mounted Xenopus laevis surface corneal epithelium at two separate time points. Three-dimensional reconstructions of confocal z-stacks of optical slices of the 8:00 AM (A, C, and E) and 4:00 PM (B, D, and F) specimens were rotated at 63° on the x-axis to enable optimal viewing of the pattern of immunolabeling. At 8:00 AM (A, C, and E), areas of lateral membranes express only the red Mel1a receptor label (large arrow) or the green Mel1c receptor label (large arrowhead). In some areas of merged Mel1a­-Mel1c co-localization, only the yellow color is observed (small arrow), indicating receptor co-localization. There are also areas of membrane that express the yellow co-localization but have small areas of red Mel1a or green Mel1c label interdigitated with the yellow label (asterisks). At 4:00 PM (B, D, and F), the lateral membranes show a more uniform pattern of immunolabeling than observed at the 8:00 AM time point. The yellow co-localization label is predominant in the most apical portion of the membranes, but in the more basal area of the lateral membranes distinct punctate red Mel1a and green Mel1c labeling is also observed. Nuclei are stained with DAPI. The confocal images in panels A and E are comprised of 16 optical slices of 400 nm each in the z-series. The confocal images in panels B and F are comprised of 16 optical slices of 400 nm each in the z-series. The images in panels C and D are comprised of a single optical slice of 400 nm. The magnification bar (F) represents 20 µm.

Similar articles

Cited by

References

    1. Pandi-Perumal SR, Trakht I, Srinivasan V, Spence DW, Maestroni GJ, Zisapel N, Cardinali DP. Physiological effects of melatonin: role of melatonin receptors and signal transduction pathways. Prog Neurobiol. 2008;85:335–53. - PubMed
    1. Cahill GM, Besharse JC. Light-sensitive melatonin synthesis by Xenopus photoreceptors after destruction of the inner retina. Vis Neurosci. 1992;8:487–90. - PubMed
    1. Guerlotte J, Greve P, Bernard M, Grechez-Cassiau A, Morin F, Collin JP, Voisin P. Hydroxyindole-O-methyltransferase in the chicken retina: immunocytochemical localization and daily rhythm of mRNA. Eur J Neurosci. 1996;8:710–5. - PubMed
    1. Martin XD, Malina HZ, Brennan MC, Hendrickson PH, Lichter PR. The ciliary body--the third organ found to synthesize indoleamines in humans. Eur J Ophthalmol. 1992;2:67–72. - PubMed
    1. Niki T, Hamada T, Ohtomi M, Sakamoto K, Suzuki S, Kako K, Hosoya Y, Horikawa K, Ishida N. The localization of the site of arylalkylamine N-acetyltransferase circadian expression in the photoreceptor cells of mammalian retina. Biochem Biophys Res Commun. 1998;248:115–20. - PubMed

Publication types

LinkOut - more resources