. 2010 Feb;67(4):611-28.
doi: 10.1007/s00018-009-0199-8. Epub 2009 Nov 21.

The metazoan ATAC and SAGA coactivator HAT complexes regulate different sets of inducible target genes

Affiliations

The metazoan ATAC and SAGA coactivator HAT complexes regulate different sets of inducible target genes

Zita Nagy et al. Cell Mol Life Sci. 2010 Feb.

Abstract

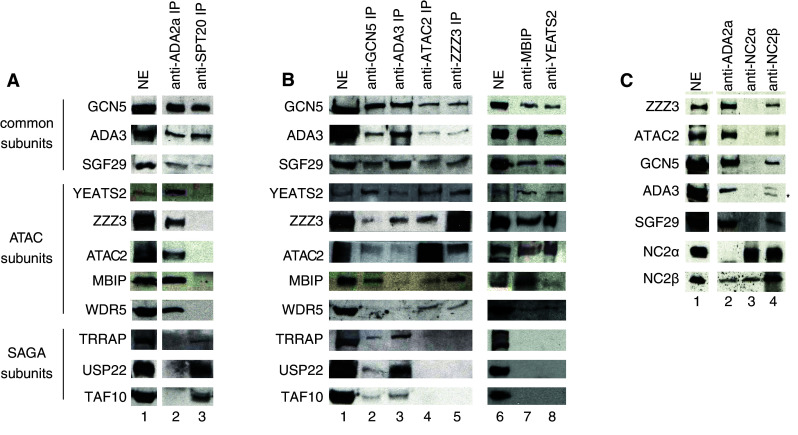
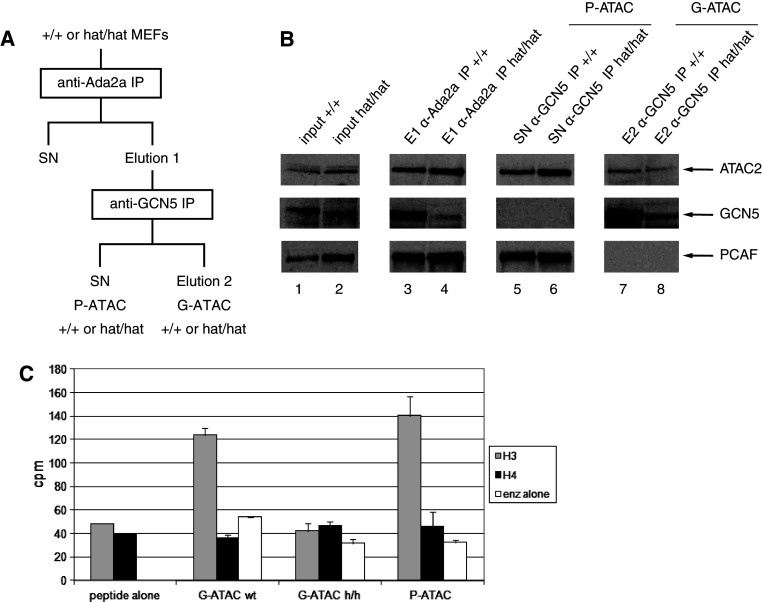
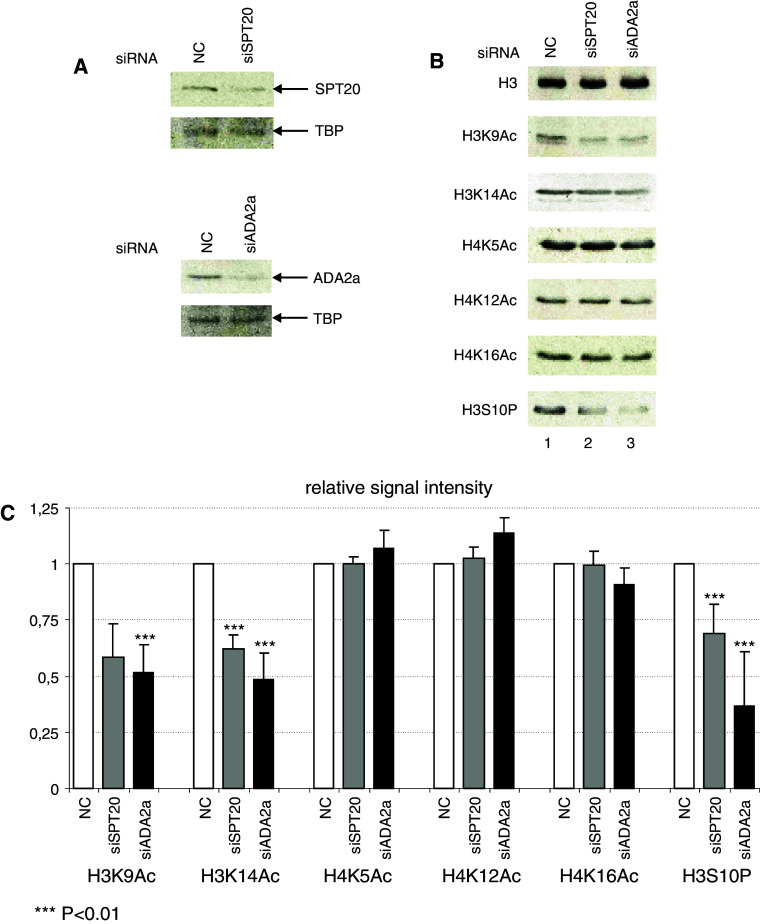
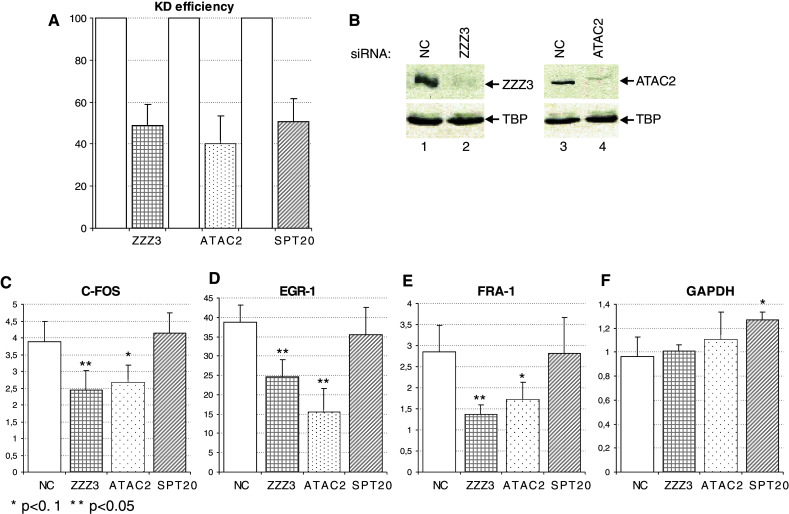
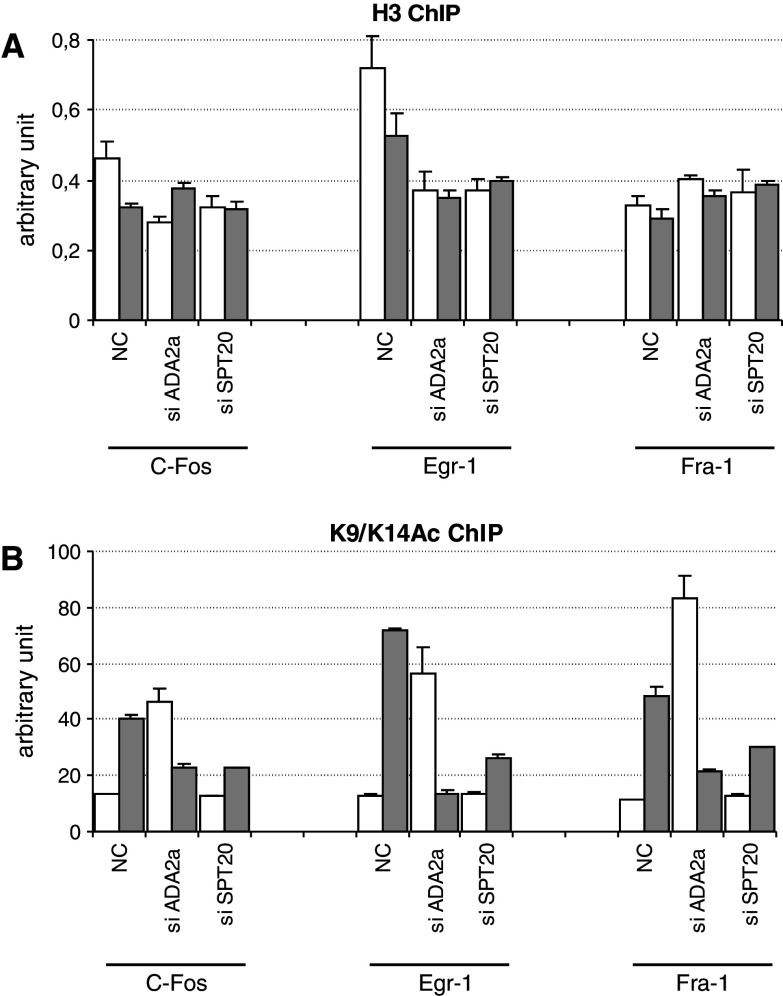
Histone acetyl transferases (HATs) play a crucial role in eukaryotes by regulating chromatin architecture and locus-specific transcription. The GCN5 HAT was identified as a subunit of the SAGA (Spt-Ada-Gcn5-Acetyltransferase) multiprotein complex. Vertebrate cells express a second HAT, PCAF, that is 73% identical to GCN5. Here, we report the characterization of the mammalian ATAC (Ada-Two-A-Containing) complexes containing either GCN5 or PCAF in a mutually exclusive manner. In vitro ATAC complexes acetylate lysine 14 of histone H3. Moreover, ATAC- or SAGA-specific knock-down experiments suggest that both ATAC and SAGA are involved in the acetylation of histone H3K9 and K14 residues. Despite their catalytic similarities, SAGA and ATAC execute their coactivator functions on distinct sets of inducible target genes. Interestingly, ATAC strongly influences the global phosphorylation level of histone H3S10, suggesting that in mammalian cells a cross-talk exists linking ATAC function to H3S10 phosphorylation.


Figures

Fig. 1
Fig. 1
Subunit composition of the endogenous human ATAC complex. a Comparison of an anti-ADA2a and an anti-hSPT20 IP reveals the differences in composition of hATAC and hSAGA, respectively. The two complexes were purified from HeLa nuclear extract (NE) by means of antibodies developed against hADA2a (lane 2) or hSPT20 (lane 3) and the coprecipitated proteins were detected by western blotting. b Different IPs demonstrate the existing interactions between hSAGA and hATAC subunits. The common, the ATAC-specific and the SAGA-specific, subunits are marked on the left side of the figure. c NC2β, but not NC2α is a component of the hATAC complex, as it copurifies with other subunits of the complex both in anti-ADA2a (lane 2) and in anti-NC2β (lane 4) IPs. Asterisk the heavy chain of the antibody
Fig. 2
Fig. 2
Histone acetyltransferase activity of the human GCN5 containing complexes and their HAT subunits. ad Acetylation activity of endogenous purified hATAC (a), hSAGA (b), recombinant (rec) GCN5 (c), and recombinant ATAC2 (d) on histone tail peptides was measured by liquid scintillography. Histone H3 peptides are shown in gray, histone H4 peptides and the reaction without peptide are in black. Note that, due to the described weak HAT activity of recombinant hATAC2 [15], in (d), ten times more recombinant protein was used than in the reactions shown in (c). e Acetylation activity of endogenous complexes on H3–H4 dimers and histone octamers. f Acetylation activity of hATAC and hSAGA complexes on mono- and polynucleosomes. In e and f, upper panels show the autoradiography and lower panels the corresponding coomassie stained histones
Fig. 3
Fig. 3
Composition of different ATAC complexes from MEFs and their HAT activity on histone tail peptides. a Purification scheme of the separation of GCN5- (G-ATAC) and PCAF-containing (P-ATAC) ATAC complexes from wild-type (+/+) and mutant (hat/hat) MEFs. b Western blot analysis of the different fractions obtained during the purification shown in (a) using the indicated antibodies. c Acetylation of histone H3 and H4 tail peptides using the indicated purified complexes was measured. The amount of the purified complexes was normalized to their ATAC2 content
Fig. 4
Fig. 4
Global changes of post translational histone modifications in cells deficient for ATAC or SAGA. a Transfection of non-targeting control siRNA (NC) or siRNAs directed against SPT20 or ADA2a leads to the specific knock-down of the targeted subunit as compared in western blot. TBP served as a loading conrol. b Changes in the histone acetylation and phosphorylation marks in siRNA-transfected cells. The global levels of the given modifications were analyzed by western blot. Blotting with an antibody recognizing the core domain of histone H3 served as a loading control. c Histone H3 post-translational modifications are perturbed in siRNA-transfected HeLa cells. Quantification of signal intensities of four independent knock-down experiments shows global changes in H3 modifications, while H4 acetylation remains unaffected. The H3S10P signal is strikingly low in siADA2a-transfected cells
Fig. 5
Fig. 5
dATAC, but not dSAGA, is recruited to TPA-induced transcription sites on Drosophila polytene chromosomes. Polytene chromosome co-staining of non-treated (a, c, e) and TPA treated (b, d, f) samples is shown. The DAPI staining (white), the anti-flag (ad) or the anti-ADA2b staining (e, f) (green), and the anti-RNA Pol II Ser5P staining (red) is shown in each panel together with the merged picture. A dramatic increase in RNA Pol II and flag-D12 (homologue of hYEATS2) or flag-CG10238 (homologue of hMBIP) colocalization occurs after TPA treatment (compare a to b and c to d) marked with arrowheads. In contrast, no increase in the colocalization was detected for ADA2b and RNA Pol II (compare e to f)
Fig. 6
Fig. 6
hATAC subunits get recruited, together with RNA Pol II, to the promoter of immediate early genes after TPA treatment. a Expression level of IE genes c-FOS, EGR-1 and FRA-1. Fold change of mRNA levels normalized by cyclophylinB are shown on the graph after 1 h of TPA treatment. White bars represent the nontreated sample, gray bars show the results obtained after TPA treatment. be ChIP results obtained with antibodies against RNA Pol II (b), ZZZ3 (c), ADA3 (d), and SPT20 (e) are shown on three IE gene promoters and the control non-coding region. Non-treated values (% input) are represented as white bars, the treated samples are shown by gray bars. Similar results were obtained in two biological replicates. Results obtained in a representative experiment are shown with SD values calculated from qPCR triplicates for each time point
Fig. 7
Fig. 7
hATAC but not hSAGA is indispensable for correct up regulation of IE genes after TPA treatment. a Knock-down efficiency of the three siRNAs (against ZZZ3, ATAC2 and SPT20) was analyzed by RT qPCR. The amount of residual mRNA is shown (bars with different patterns) compared to the negative control (NC) siRNA-transfected cells (white bars). b Knock-down efficiency of the siZZZ3 (lane 2) and siATAC2 (lane 4) was analyzed by western blotting and compared to negative control (NC) siRNA-transfected cells (lanes 1, 3). As a loading control, the same blot was developed with an anti-TBP antibody. cf. Induction of IE gene expression after TPA treatment in cells transfected with different siRNAs (indicated on the bottom of the graphs). Results of IE genes or GAPDH mRNA quantification are shown as fold change over the non-treated samples and represent three independent experiments. The different patterns of the bars refer to a
Fig. 8
Fig. 8
Histone H3 acetylation is strongly affected in ATAC deficient cells at the promoter of IE genes. a ChIP results of siRNA-transfected cells obtained at the promoter of three IE genes (see Fig. 6a for indications) are represented before and after induction with TPA treatment (white and gray bars, respectively). The chromatin was immunoprecipitated with an antibody recognizing the core domain of H3. Results were normalized with those obtained at a non-transcribed region of the genome. The siRNA used for knocking down specific subunits of ATAC or SAGA is marked on the axis. b ChIP results obtained with an antibody specifically recognizing the H3K9/K14Ac signal shows perturbation at the promoter of TPA induced genes in siADA2a-transfected cells compared to the control (NC). In siSPT20-transfected cells, the response to stimulation at the acetylation level seems to be only slightly affected. Results are shown with SD values calculated from qPCR triplicates for each time point

Similar articles

Cited by

References

    1. Kouzarides T. Chromatin modifications and their function. Cell. 2007;128:693–705. doi: 10.1016/j.cell.2007.02.005. - DOI - PubMed
    1. Hayes JJ, Hansen JC. Nucleosomes and the chromatin fiber. Curr Opin Genet Dev. 2001;11:124–129. doi: 10.1016/S0959-437X(00)00168-4. - DOI - PubMed
    1. Li B, Carey M, Workman JL. The role of chromatin during transcription. Cell. 2007;128:707–719. doi: 10.1016/j.cell.2007.01.015. - DOI - PubMed
    1. Nagy Z, Tora L. Distinct GCN5/PCAF-containing complexes function as co-activators and are involved in transcription factor and global histone acetylation. Oncogene. 2007;26:5341–5357. doi: 10.1038/sj.onc.1210604. - DOI - PubMed
    1. Shahbazian MD, Grunstein M. Functions of site-specific histone acetylation and deacetylation. Annu Rev Biochem. 2007;76:75–100. doi: 10.1146/annurev.biochem.76.052705.162114. - DOI - PubMed

Publication types