. 2010 Mar;119(3):291-302.
doi: 10.1007/s00401-009-0615-z.

Correlation of hypointensities in susceptibility-weighted images to tissue histology in dementia patients with cerebral amyloid angiopathy: a postmortem MRI study

Affiliations

Correlation of hypointensities in susceptibility-weighted images to tissue histology in dementia patients with cerebral amyloid angiopathy: a postmortem MRI study

Matthew Schrag et al. Acta Neuropathol. 2010 Mar.

Abstract

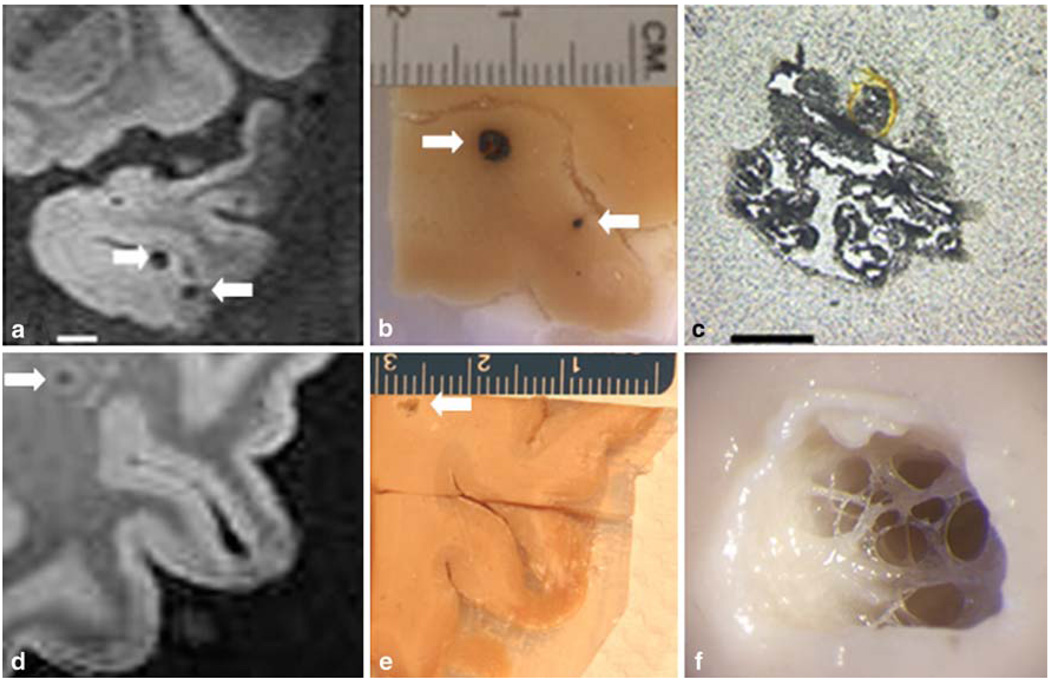
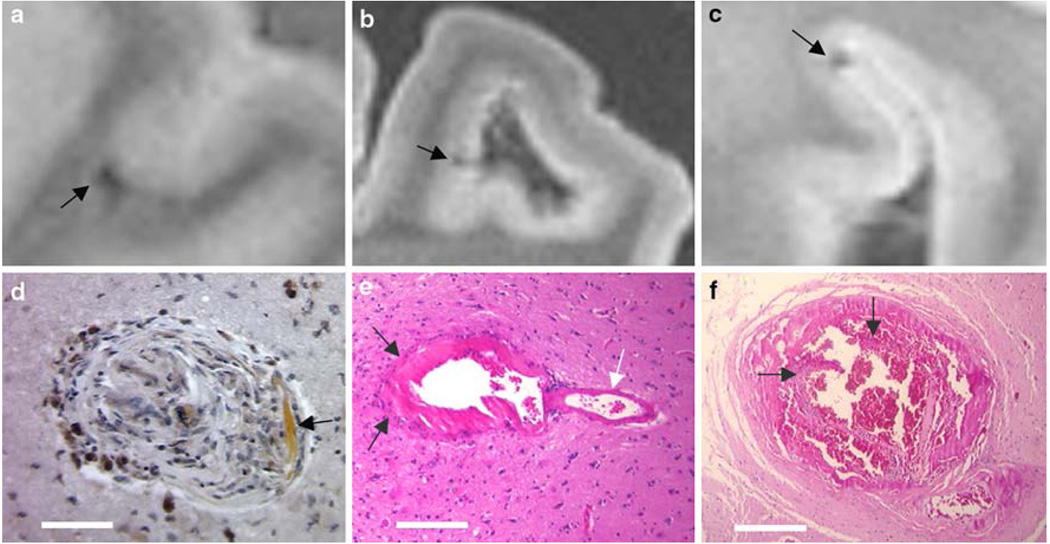
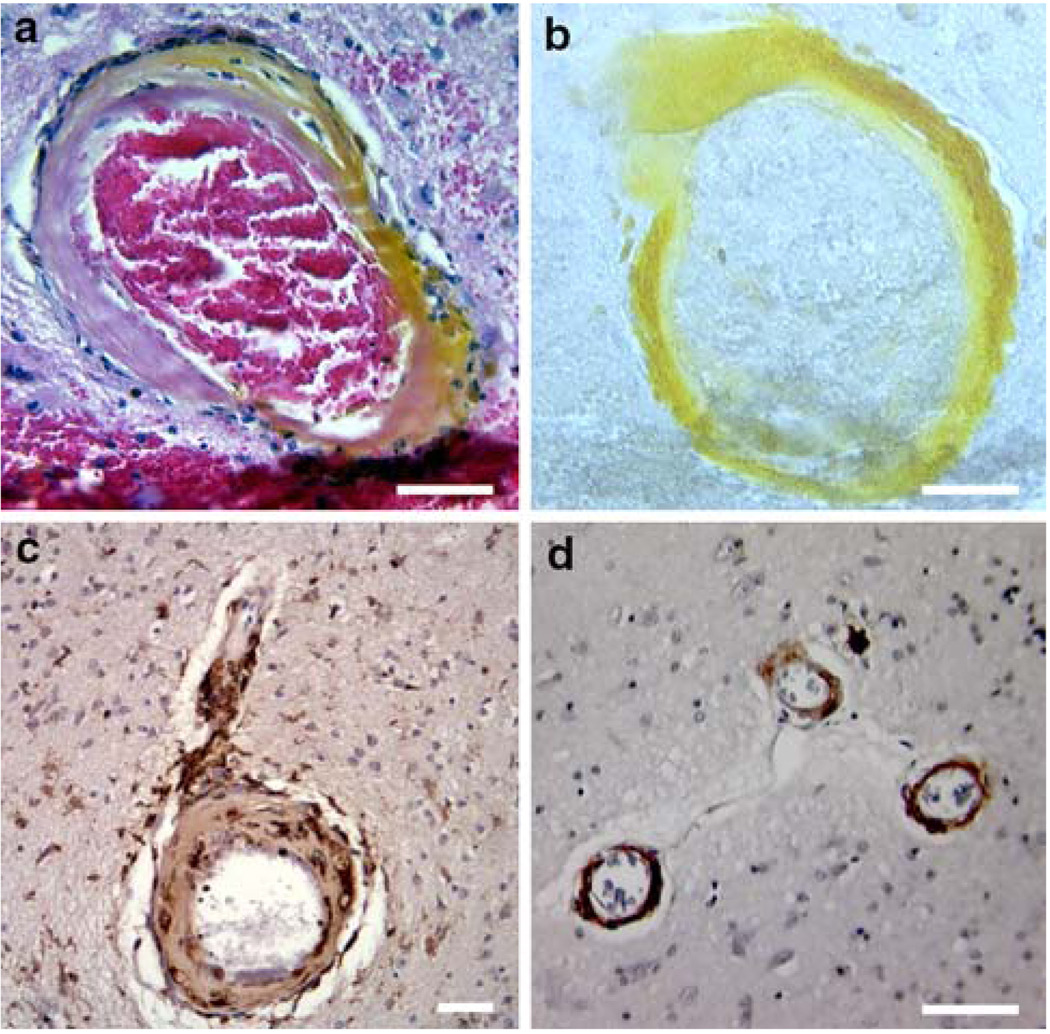
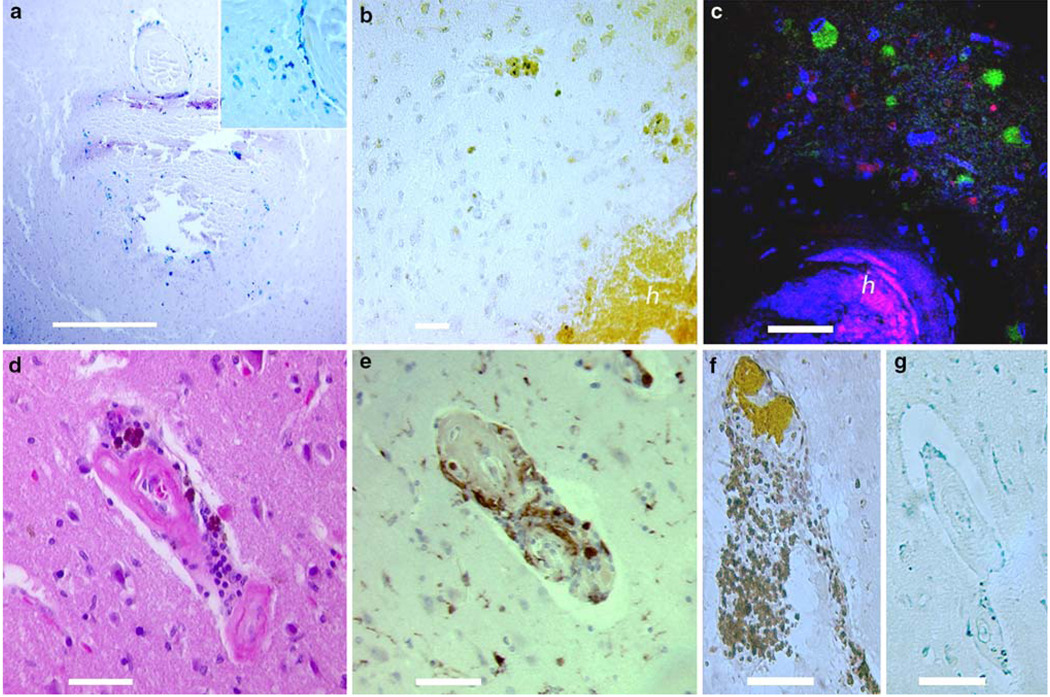
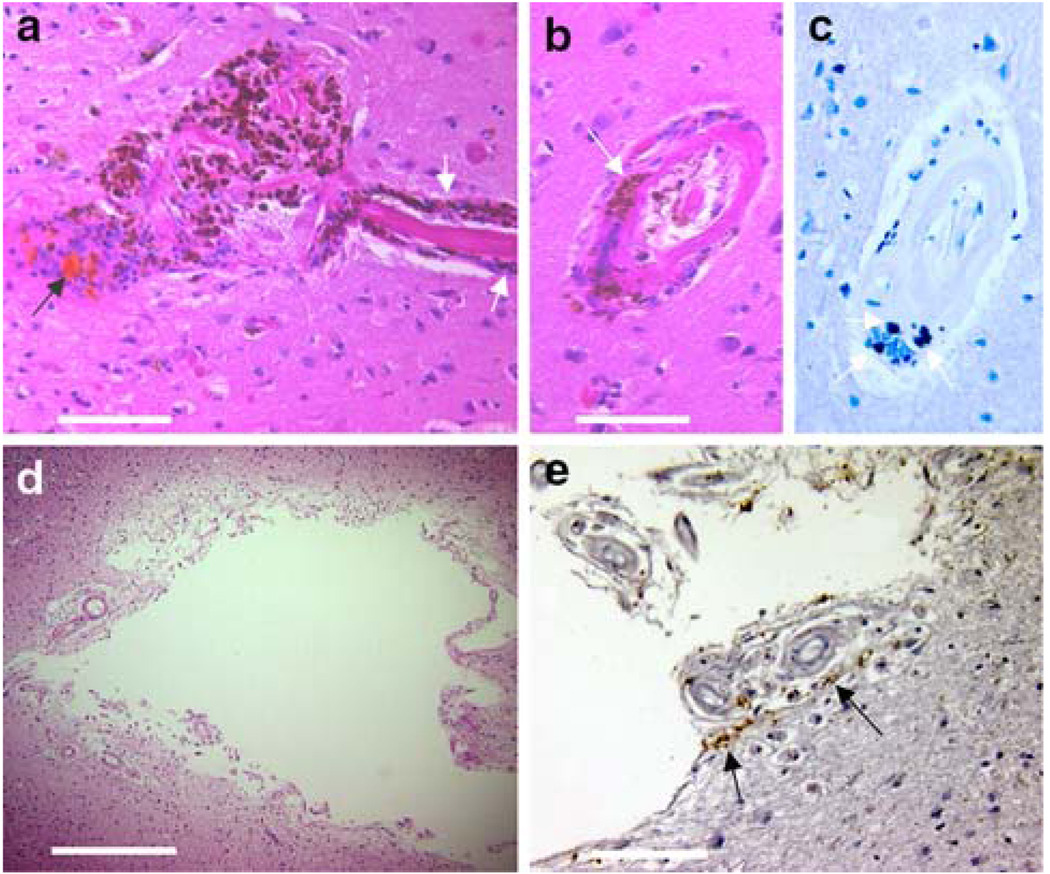
Neuroimaging with iron-sensitive MR sequences [gradient echo T2* and susceptibility-weighted imaging (SWI)] identifies small signal voids that are suspected brain microbleeds. Though the clinical significance of these lesions remains uncertain, their distribution and prevalence correlates with cerebral amyloid angiopathy (CAA), hypertension, smoking, and cognitive deficits. Investigation of the pathologies that produce signal voids is necessary to properly interpret these imaging findings. We conducted a systematic correlation of SWI-identified hypointensities to tissue pathology in postmortem brains with Alzheimer’s disease (AD) and varying degrees of CAA. Autopsied brains from eight AD patients, six of which showed advanced CAA, were imaged at 3T; foci corresponding to hypointensities were identified and studied histologically. A variety of lesions was detected; the most common lesions were acute microhemorrhage, hemosiderin residua of old hemorrhages, and small lacunes ringed by hemosiderin. In lesions where the bleeding vessel could be identified, β-amyloid immunohistochemistry confirmed the presence of β-amyloid in the vessel wall. Significant cellular apoptosis was noted in the perifocal region of recent bleeds along with heme oxygenase 1 activity and late complement activation. Acutely extravasated blood and hemosiderin were noted to migrate through enlarged Virchow–Robin spaces propagating an inflammatory reaction along the local microvasculature; a mechanism that may contribute to the formation of lacunar infarcts. Correlation of imaging findings to tissue pathology in our cases indicates that a variety of CAA-related pathologies produce MR-identified signal voids and further supports the use of SWI as a biomarker for this disease.


Figures

Fig. 1
Fig. 1
Correlation of hypointensities and tissue pathology. The stepwise isolation of two lesions is illustrated above. In image a, a hypointensity in SWI is noted in the left temporal lobe. The corresponding lesion is shown in image b. This hematoma is typical of those located in grey matter, the blood does not diffuse into the tissue, but remains encapsulated within a pseudocapsule. A second lesion is present in this tissue block; the size of this lesion is overestimated by SWI, illustrating the “blooming effect” of this technology (arrows in a and b). Another hypointensity located in the white matter of the left parietal lobe is indicated in image d (scale is equal to image a). The corresponding lesion has been dissected in image e and is shown under a dissecting microscope in image f. The final image shows a cavitary lesion trabeculated by vascular elements. Further histologic workup of the lesion demonstrated hemosiderin granules within a gliotic capsule (see Fig. 6). Scale bars a 5 mm, c 1 mm
Fig. 2
Fig. 2
MR hypointensities without grossly visible pathology. The vast majority of hypointensities were associated with hemorrhages visible upon dissection; however, a few required more extensive investigation. Images a, b, c are MR images corresponding to the lesions shown in d, e, f, respectively. Shown in image d is a well-healed lesion consisting of focal scarring with hemosiderin deposits stained by DAB-enhanced Prussian blue stain. Hematoidin deposition is also noted in the lesion (white arrow). Image e shows an arteriolar aneurysm (arrows indicate the dome of the aneurysm; white arrow indicates the “parent” artery). Image f shows a severely dilated vessel with a dissection in the endothelium and blood in the vessel wall (arrows point the ruptured endothelial layer). Scale bars d 100 µm, e 250 µm, f 500 µm
Fig. 3
Fig. 3
The “blooming effect” of signal voids induced by hemosiderin-iron. The theoretical equality of lesion size to MR hypointensity size is graphed in red. The actual measurements are shown in the scatter plot and almost all the lesions are smaller than their associated MR finding. The signal voids averaged 1.58 ± 0.75 times the size of the associated lesion
Fig. 4
Fig. 4
Vascular damage associated with CAA and hemorrhage. Images a and b show the vessel associated with the lesion in Fig. 1c. The vessel wall is hypocellular, eosinophilic and is surrounded by prominent macrophages. The arteriole is stained a brilliant yellow by the endogenous pigment hematoidin (a breakdown product of biliverdin indicating the presence of heme oxygenase activity). Image b represents an immunohistochemical stain of the same vessel demonstrating the presence of β-amyloid in the vessel wall (non-specific staining of the hemorrhage is present inferiorly in the photo). Image c represents an immunohistochemical stain against CD68, a marker of macrophages and microglia, demonstrating intense microglial activation around vascular elements and macrophages in the vessel wall. Image d shows immunohistochemistry for complement C6. The microvessels in CAA stain strongly for C6 in the tunica media. Scale bars a and b 50 µm, c and d 100 µm
Fig. 5
Fig. 5
The local tissue reaction. Immunohistochemical staining highlights the local inflammatory response produced by a hematoma. Image a is a Prussian blue stain showing hemosiderin-laden macrophages infiltrating a hematoma. Iron-loaded macrophages are also prominent around the injured vessel (inset). Image b is stained by DAB over an anti-HO-1 primary antibody and illustrates intense heme oxygenase 1 (HO-1) reactivity within a hematoma and extending into the surrounding parenchyma (h indicates hematoma). Image c is a merged fluorescent study with MAP2/TexasRed staining in red to mark neurons, DAPI in blue to mark all cell nuclei and anti-HO-1/ FITC in green showing the presence of HO-1; the hematoma is visible in the inferior portion of the photo as non-specific staining (again labeled h). Perinuclear HO-1 expression is noted in the perifocal zone in non-neuronal cells. Image d shows an H&E of a vessel with perivascular heme-degradation products and surrounding inflammatory cells. Image e shows CD68 reactivity indicating a prominent microglial response around the same vessel. CD3 and CD20 staining of the same vessel are shown in images f and g, respectively. These images show that the inflammatory cells are primarily T lymphocytes, with negligible evidence of B cells. Scale bars b and c 50 µm, all others = 100 µm
Fig. 6
Fig. 6
Perivascular hemosiderin deposition may contribute to subsequent ischemic changes. Image a shows a hemorrhage around a degenerated arteriole with hematoidin deposition (yellow/orange material at black arrow), significant local inflammation and hemosiderin both in the lesion and tracking in the perivascular space along the arteriole (white arrow). Image b shows another vessel, ~500 µm distant from the lesion in image a, with extensive perivascular hemosiderin (arrow). Unenhanced Prussian blue staining of the same vessel is shown in image c. Hemosiderin was present around both capillaries and arterioles at a distance of more than twice the diameter of the lesion and was accompanied by inflammatory cells. Image d shows another lesion that appeared as a hypointensity in SWI (the cavitary lesion shown in Fig. 1d–f) and on pathological examination proved to be a lacunar infarct. Image e shows DAB-enhanced Prussian blue staining of the capsule around the lesion. The vessels are also surrounded by numerous inflammatory cells and hemosiderin-laden macrophages (arrows). Scale bars a and e 200 µm, b 100 µm, d 1 mm

References

    1. Aliev G, Smith MA, Seyidov D, et al. The role of oxidative stress in the pathophysiology of cerebrovascular lesions in Alzheimer’s disease. Brain Pathol. 2002;12:21–35. - PMC - PubMed
    1. Anders K, Wang Z, Kornfeld M, et al. Giant cell arteritis in association with cerebral amyloid angiopathy: immunohistochemical and molecular studies. Hum Pathol. 1997;89:1237–1246. - PubMed
    1. Atlas SW, Mark AS, Grossman RI, Gomori JM. Intracranial hemorrhage: gradient-echo MR imaging at 1.5 T. Comparison with spin-echo imaging and clinical applications. Radiology. 1988;168:803–807. - PubMed
    1. Blamire A, Rowe J, Styles P, McDonald B. Optimising imaging parameters for post mortem MR imaging of the human brain. Acta Radiol. 1999;40:593–597. - PubMed
    1. Bush V, Moyer T, Batts K, Parisi J. Essential and toxic element concentrations in fresh and formalin-fixed human autopsy tissues. Clin Chem. 1995;41(2):284–294. - PubMed

Publication types

MeSH terms