. 2010 Jan;102(1):9-29.
doi: 10.1007/s00422-009-0347-0. Epub 2009 Nov 24.

Phase-linking and the perceived motion during off-vertical axis rotation

Affiliations

Phase-linking and the perceived motion during off-vertical axis rotation

Jan E Holly et al. Biol Cybern. 2010 Jan.

Abstract

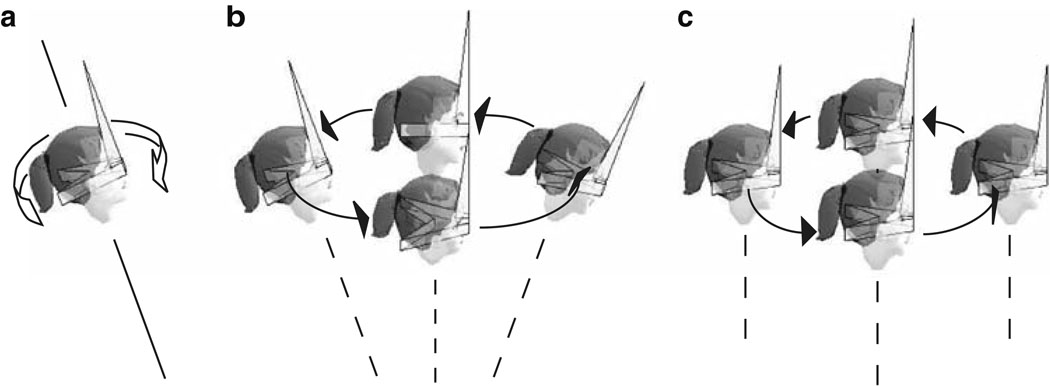
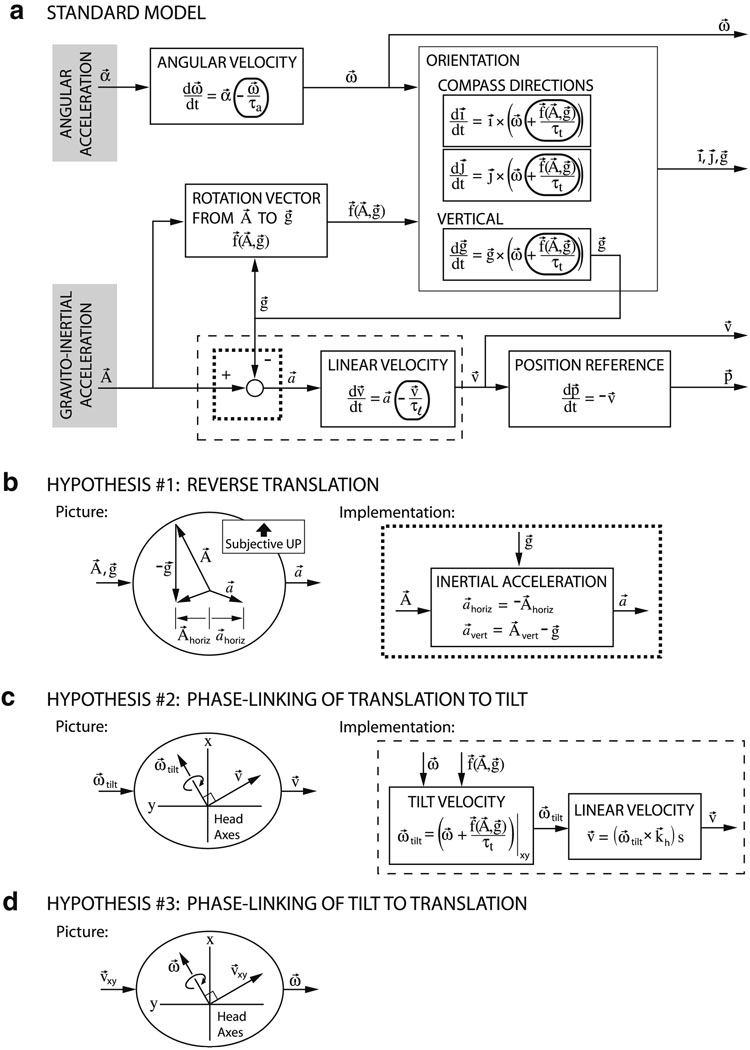
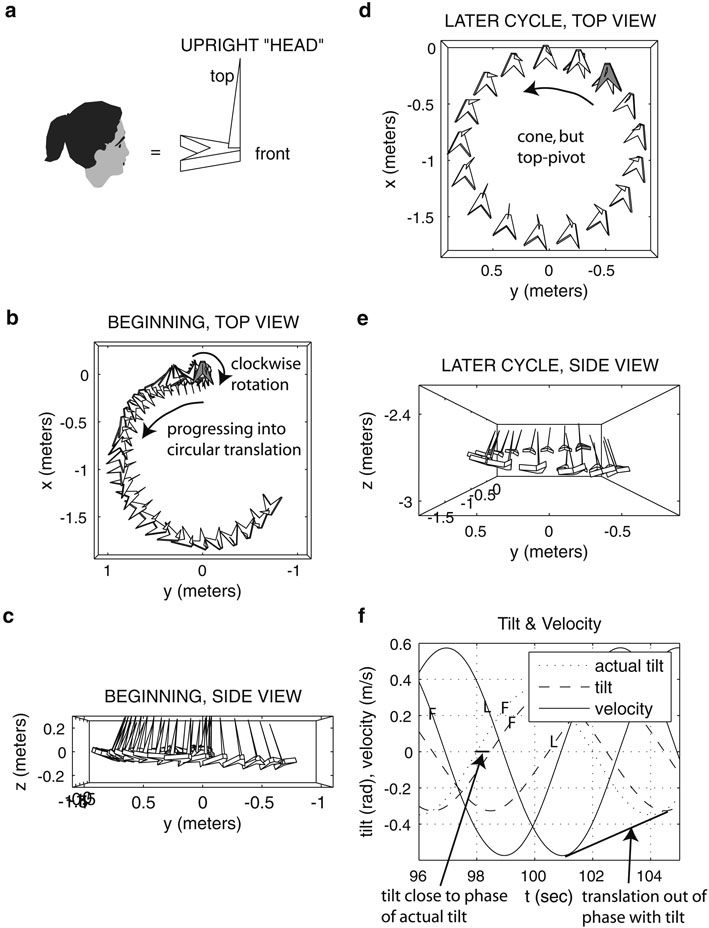
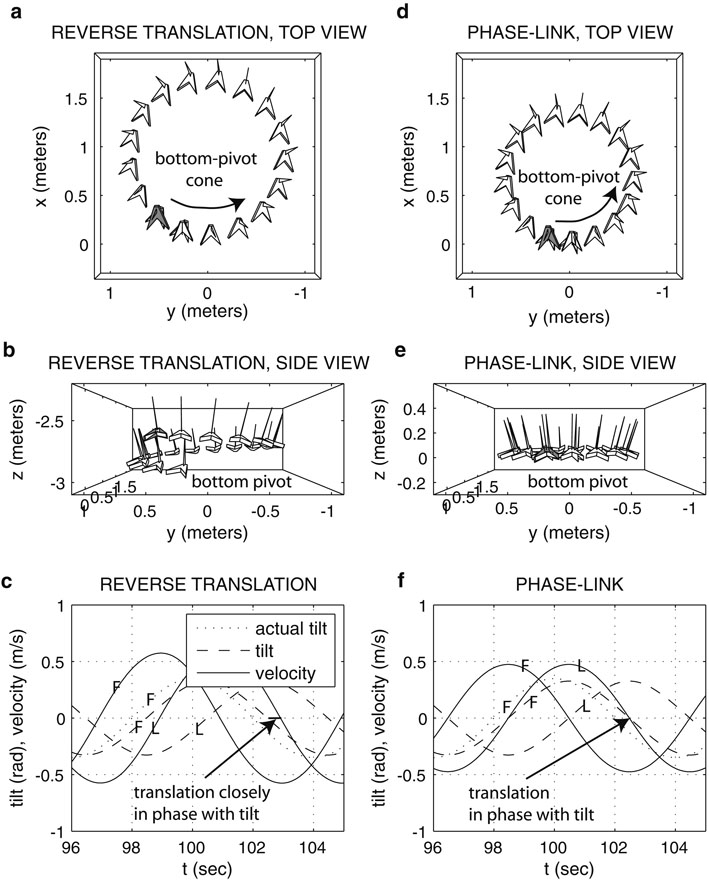
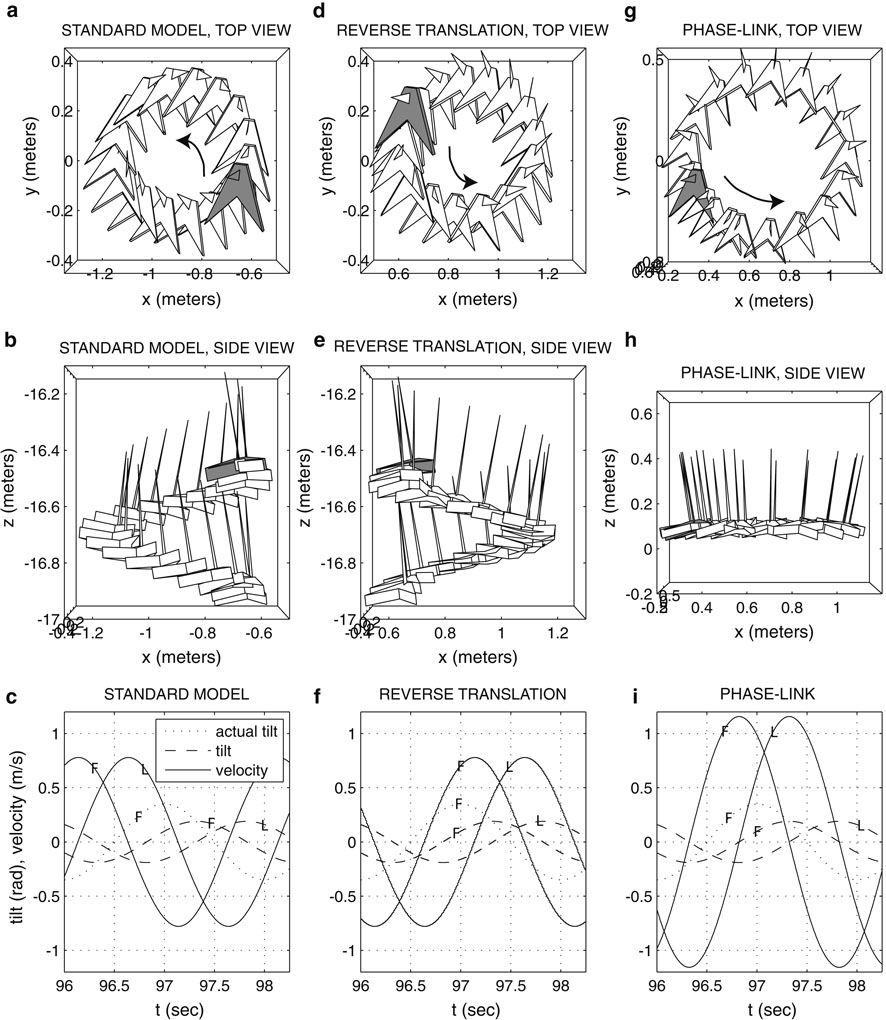
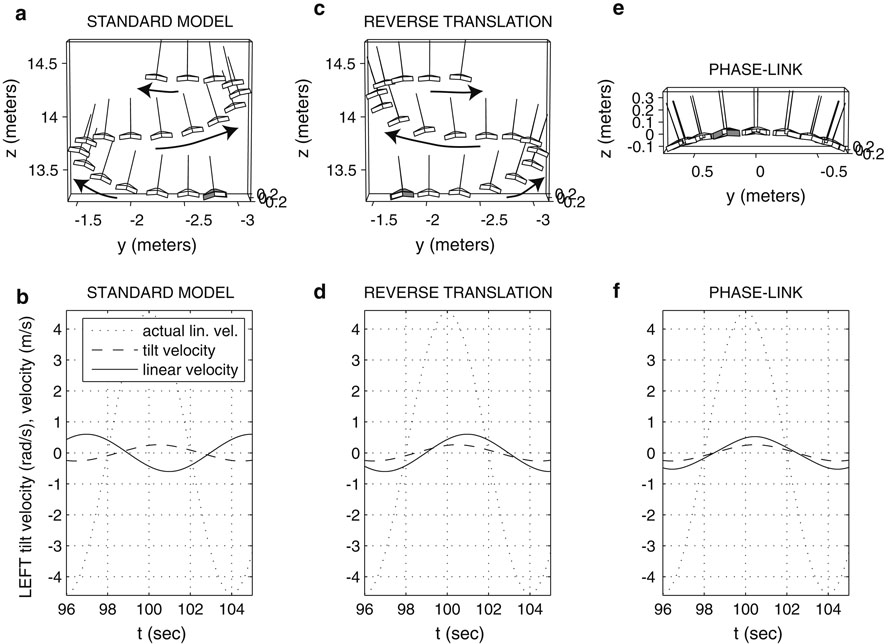
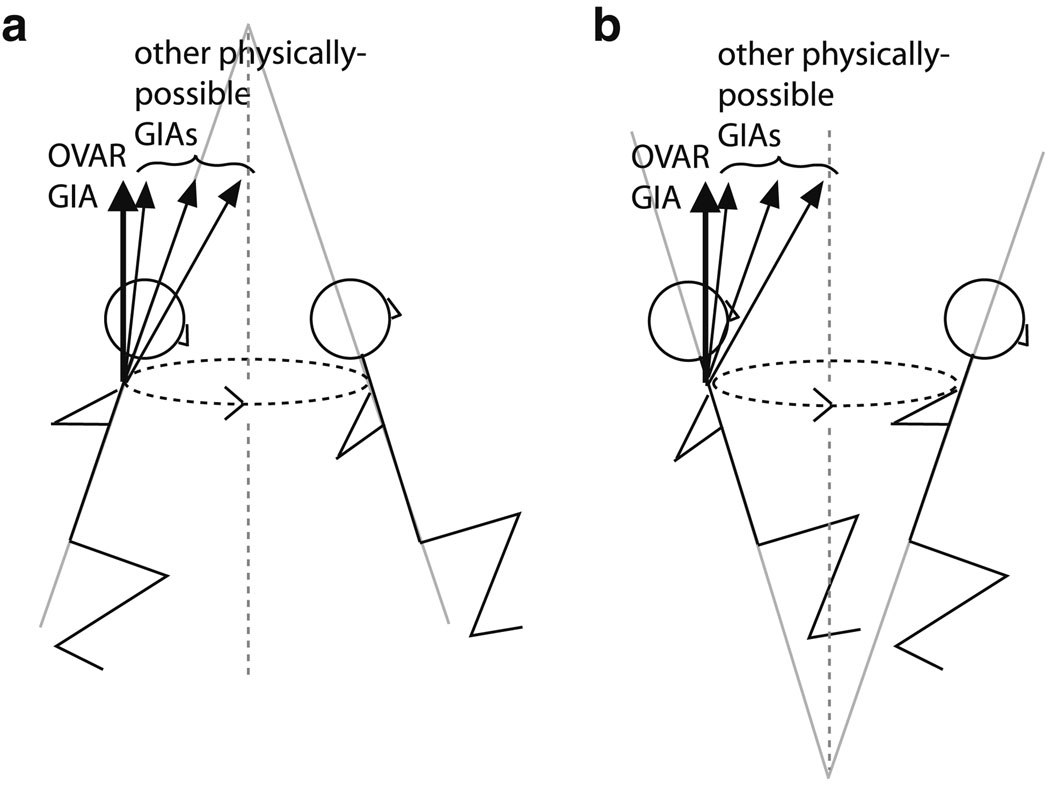
Human off-vertical axis rotation (OVAR) in the dark typically produces perceived motion about a cone, the amplitude of which changes as a function of frequency. This perception is commonly attributed to the fact that both the OVAR and the conical motion have a gravity vector that rotates about the subject. Little-known, however, is that this rotating-gravity explanation for perceived conical motion is inconsistent with basic observations about self-motion perception: (a) that the perceived vertical moves toward alignment with the gravito-inertial acceleration (GIA) and (b) that perceived translation arises from perceived linear acceleration, as derived from the portion of the GIA not associated with gravity. Mathematically proved in this article is the fact that during OVAR these properties imply mismatched phase of perceived tilt and translation, in contrast to the common perception of matched phases which correspond to conical motion with pivot at the bottom. This result demonstrates that an additional perceptual rule is required to explain perception in OVAR. This study investigates, both analytically and computationally, the phase relationship between tilt and translation at different stimulus rates-slow (45 degrees /s) and fast (180 degrees /s), and the three-dimensional shape of predicted perceived motion, under different sets of hypotheses about self-motion perception. We propose that for human motion perception, there is a phase-linking of tilt and translation movements to construct a perception of one's overall motion path. Alternative hypotheses to achieve the phase match were tested with three-dimensional computational models, comparing the output with published experimental reports. The best fit with experimental data was the hypothesis that the phase of perceived translation was linked to perceived tilt, while the perceived tilt was determined by the GIA. This hypothesis successfully predicted the bottom-pivot cone commonly reported and a reduced sense of tilt during fast OVAR. Similar considerations apply to the hilltop illusion often reported during horizontal linear oscillation. Known response properties of central neurons are consistent with this ability to phase-link translation with tilt. In addition, the competing "standard" model was mathematically proved to be unable to predict the bottom-pivot cone regardless of the values used for parameters in the model.


Figures

Fig. 1
Fig. 1
Off-vertical axis rotation and typical perceptions, shown with a head and simultaneously the polyhedron that represents the head in later figures. a Actual motion of rotation about an off-vertical axis. Shown here is clockwise yaw, for which tilt causes the horizontal component of force, and therefore the GIA, to come from the directions, repetitively in order of, back, right, front, and left, b typical perception during slow OVAR: a cone-shaped motion. The cone progresses counterclockwise with the GIA due to tilt and centripetal acceleration coming from directions in the same order implied by part (a) of, back, right, front, and left, c typical perception during fast OVAR: a cylinder-shaped motion. The cylinder progresses counterclockwise with the GIA associated with centripetal acceleration coming from directions in the same order implied by part (a) of, back, right, front, and left
Fig. 2
Fig. 2
Models for testing hypotheses. a Standard Model. All vectors are in subject coordinates: α = angular acceleration; ω = angular velocity; i, j = unit vectors giving heading, implemented here as the starting-point earth-horizontal projection of noseward and leftward directions, respectively; g = earth-upward vector of magnitude 9.81 m/s2; A = gravito-inertial acceleration; a = linear acceleration; v = linear velocity; p = position of an earth-fixed reference point, implemented here as the starting position of the head, to keep track of 3-D position; f(A, g) = the vector with magnitude equal to the angle between A and g, and direction that of rotation from A to g. The vectors α and A are given by the stimulus, and all other vectors are perceptual estimates. Additional intermediate components such as sensor dynamics and internal models of sensor dynamics are combined into the concise set of time constants shown; for example, semicircular canal dynamics, their internal model, and any extension of the resulting time constant for perception are combined into the single perceptual time constant τa. The linear and tilt time constants are τl and τt, respectively. An internal model of the variables is assumed and necessary, as derivatives depend upon the variables themselves in many of the blocks (explicit loops not shown for these simple dependencies). The model comprises three-dimensional laws of physics except for the circled pieces with time constants, which give tendencies of the perceptual system. The output variables are given from the subject’s perspective, in head coordinates, but for scientific purposes of analysis and three-dimensional display in later figures, the output is transformed in the standard way to earth coordinates. Dashed boxes indicate pieces replaced by alternative hypotheses as described in parts (b, c), b reverse translation model. The earth-vertical component of a is calculated in the same way as in the Standard Model, while the earth-horizontal component is reversed from that in the Standard Model. Shown are a graphical representation of the hypothesis and the technical implementation which replaces the dotted box in part (a), with vectors defined as in part (a), in addition to ahoriz and Ahoriz representing the (subjective) earth-horizontal components of a and A, respectively, c model of translation phase-linked to tilt. Linear velocity is linked to the Standard Model’s computation of tilt. Tilt velocity, ωtilt, is defined as the head xy-projection of the angular velocity vector including that toward aligning g with A. Linear velocity is then computed in such a way to be in the same direction as the tilt, e.g., rightward tilt velocity implies rightward linear velocity. Shown are a graphical representation of the hypothesis and the technical implementation using a cross product with a unit vector, kh, in the head’s z direction to give the correct direction of translation, as well as a scaling factor to give the amount of translation relative to the tilt. For this study, s = 2was used; other values simply give different amounts of excursion analogous to inter-individual variation in amount of perceived translation. The technical implementation replaces the dashed box in part (a), d model of tilt phase-linked to translation. Angular velocity is linked to the Standard Model’s computation of head-horizontal linear velocity, represented by vxy. Shown is a graphical representation of the hypothesis, which is implemented only conceptually as explained in the text
Fig. 3
Fig. 3
Standard Model results for slow OVAR, a polyhedral “head” used in 3-D animations, for indication of orientations, b beginning of Standard Model simulation, top view, in freeze-frame format with a polyhedral head showing the location and orientation every 0.5 s (which is 1/16 of an actual rotation). The gray head is at time zero, tilted back 20°, and the first jumbled heads are indicating a clockwise rotation, roughly on axis. Translation slowly begins, progresses in a counterclockwise direction. The initial 18 s are shown, during which just over two actual rotations take place, c same motion, side view, indicating that a slight downward motion begins, d later portion of the same Standard Model simulation, starting at the 96 s point and continuing for 9 s, during which just over one actual rotation takes place. The gray head is at time 96 s; at that time, the actual head orientation is tilt-back 20°. The motion is progressing in a counterclockwise top-pivot cone, e same portion of simulation as in part (d), showing continuous downward motion in a side view, f tilt and linear velocities during the cycle shown in parts (d, e). Leftward is indicated by L and forward is indicated by F. The actual forward tilt of the subject (i.e., the imposed backward tilt of the GIA) is also shown. Linear velocities are in earth-based coordinates. As reported experimentally by many subjects, the forward tilt has phase close to actual forward tilt. However, the leftward linear velocity, which should be in phase with forward tilt for a bottom-pivot cone, is instead completely out of phase
Fig. 4
Fig. 4
Results of simulations with alternative Hypotheses #1 and #2, reverse translation and phase-linking to translation to tilt, for slow OVAR, for 9 s starting at the 96 s point. The same conventions are used as in Fig. 3. a simulation testing Hypothesis #1 with translation phase reversed. The motion is progressing in a counterclockwise bottom-pivot cone, b same motion, side view, showing continuous downward motion, c tilt and linear velocities during the cycle shown in parts (a, b). Leftward is indicated by L and forward is indicated by F. The actual forward tilt of the subject (i.e., the imposed backward tilt of the GIA) is also shown. Linear velocities are in earth-based coordinates. As reported experimentally by subjects, the leftward linear velocity is closely in phase with forward tilt, d simulation testing Hypothesis #2 with translation phase-linked to tilt. The motion is progressing in a counterclockwise bottom-pivot cone, e same motion, side view, f tilt and linear velocities during the cycle shown in parts (d, e), with the same conventions as in part (c). As reported experimentally by subjects, the leftward linear velocity is in phase with forward tilt
Fig. 5
Fig. 5
Fast OVAR, results of simulations with Standard Model and alternative Hypotheses #1 and #2, starting at the 96 s point and continuing for 2.5 s, during which just over one actual rotation takes place. The freeze-frame format has a polyhedral head every 0.125 s (which is 1/16 of an actual rotation). As indicated by the scale, the amount of translation is less than for slow OVAR (Fig. 3, Fig. 4); the figure is therefore zoomed in for a better view. In all 3-D plots, the gray head is at time 96 s; at that time, the actual head orientation is tilt-back 20°. a Standard Model simulation, top view. The motion is circular with the bottom of the head slightly leading the path around the circle, b same motion, side view, indicating continuous downward motion, c tilt and linear velocities during the cycle shown in parts (a, b). Leftward is indicated by L and forward is indicated by F. The actual forward tilt of the subject (i.e., the imposed backward tilt of the GIA) is also shown. Linear velocities are in earth-based coordinates, d simulation with translation phase reversed, top view. The motion is circular with the top of the head slightly leading the path around the circle, e same motion, side view, showing continuous downward motion, f tilt and linear velocities during the cycle shown in parts (d, e), with the same conventions as in part (c), g simulation testing Hypothesis #2 with translation phase-linked to tilt. The motion is progressing in a counterclockwise bottom-pivot cone, h same motion, side view, i tilt and linear velocities during the cycle shown in parts (g, h), with the same conventions as in part (c)
Fig. 6
Fig. 6
Horizontal linear oscillation, results of simulations with Standard Model and alternative Hypotheses #1 and #2 for slow (1/8Hz) oscillation, starting at the 96 s point and continuing for 9 s, during which just over one actual cycle takes place. All 3-D plots are shown from the back view, with the “sail” of the head showing the tilt. In all 3-D plots, the gray head is at time 96 s; at that time, the actual head position is at center, moving rightward. a standard model simulation. The motion snakes upward in a swinging manner, b tilt and linear velocities during the motion shown in part (a). The actual linear velocity of the subject is also shown. Linear velocities are in earth-based coordinates, c simulation testing Hypothesis #1 with translation phase reversed. The motion snakes upward in a rocking manner, d tilt and linear velocities during the motion shown in part (c), with the same conventions as in part (b), e simulation testing Hypothesis #2 with translation phase-linked to tilt. The head moves back and forth as over a hilltop, f tilt and linear velocities during the motion shown in part (e), with the same conventions as in part (e)
Fig. 7
Fig. 7
Two possible perceived cones during OVAR with approximate direction of detected GIA (OVAR GIA with thick arrow), as well as other examples of directions of the GIA that would occur during actual conical motion. The other physically possible GIAs point inward toward the axis of rotation because of centripetal acceleration. a Top-pivot cone as predicted by the Standard Model, b bottom-pivot cone as predicted by phase-linking translation to tilt

Similar articles

Cited by

References

    1. Albright TD. Centrifugal directional bias in the middle temporal visual area (MT) of the macaque. Vis Neurosci. 1989;2:177–188. - PubMed
    1. Anastasopoulos D, Bronstein AM. A case of thalamic syndrome: somatosensory influences on visual orientation. J Neurol Neurosurg Psychiatry. 1999;67:390–394. - PMC - PubMed
    1. Angelaki DE. Dynamic polarization vector of spatially tuned neurons. IEEE Trans Biomed Eng. 1991;38:1053–1060. - PubMed
    1. Angelaki DE. Spatio-temporal convergence (STC) in otolith neurons. Biol Cybern. 1992;67:83–96. - PubMed
    1. Angelaki DE, Dickman JD. Spatiotemporal processing of linear acceleration: primary afferent and central vestibular neuron responses. J Neurophysiol. 2000;84:2113–2132. - PubMed

Publication types