

Tessellation analysis of glomerular spatial arrangement in mice with heritable renal hypoplasia
- PMID: 19937638
- PMCID: PMC3162479
- DOI: 10.1002/ar.21038
Tessellation analysis of glomerular spatial arrangement in mice with heritable renal hypoplasia
Abstract
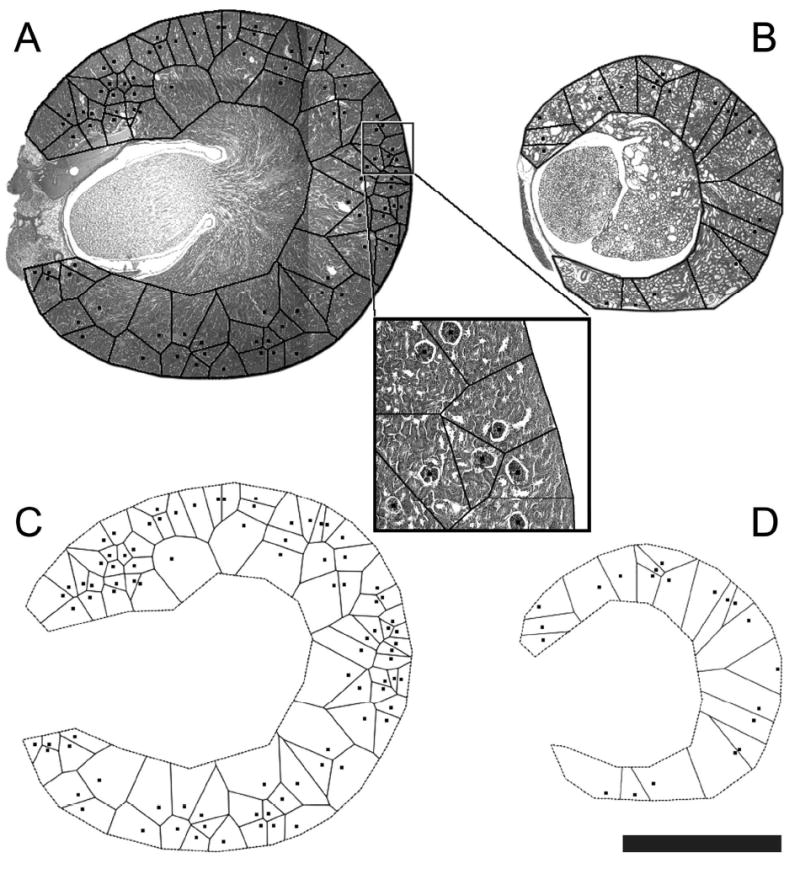
Renal hypoplasia results from an insufficient kidney volume caused, in part, by a deficient number of glomeruli. The purpose of this study was to apply tessellation analysis to determine whether glomerular point patterns differed between adult normal (WT) and mutant (Br) mice with heritable renal hypoplasia and to delineate a spatial distribution accounting for the observed patterns. Kidneys from adult WT and Br mice were collected, processed with routine light histology and representative transverse sections were photographed. Cortical area and perimeter were calculated from traced tissue contours and glomeruli were identified and digitized. Voronoi tessellations were constructed and average parameters for Voronoi polygon number, area, perimeter and edge counts as well as spatial metrics comprising nearest neighbor and centroidal distances were calculated and compared. Point distributions were simulated by randomizing glomerular coordinates from each section and plotting the new points utilizing uniform random, Gaussian random, or isotropic functions. Average nearest neighbor distances were generated for each specimen and ranked with respect to corresponding values generated from 1,000 iterations for each simulated set. Results showed that WT and Br were significantly different for each parameter suggesting that WT kidneys possessed more glomeruli, but these were less clustered compared to Br. Simulations suggested that WT and Br demonstrated similar, but not identical, underlying glomerular spatial distributions. Defective gene expression in Br is important for determining glomerular number and the defective pattern likely results from a heterochronic disturbance consisting of a truncated growth trajectory during embryonic kidney development.
2009 Wiley-Liss, Inc.
Figures


Similar articles
-
Deficiency in Six2 during prenatal development is associated with reduced nephron number, chronic renal failure, and hypertension in Br/+ adult mice.Am J Physiol Renal Physiol. 2009 May;296(5):F1166-78. doi: 10.1152/ajprenal.90550.2008. Epub 2009 Feb 4. Am J Physiol Renal Physiol. 2009. PMID: 19193724 Free PMC article.
-
Measuring the intrarenal distribution of glomerular volumes from histological sections.Am J Physiol Renal Physiol. 2016 Jun 1;310(11):F1328-36. doi: 10.1152/ajprenal.00382.2015. Epub 2016 Mar 16. Am J Physiol Renal Physiol. 2016. PMID: 26984953 Free PMC article.
-
High-salt diet reveals the hypertensive and renal effects of reduced nephron endowment.Am J Physiol Renal Physiol. 2010 Jun;298(6):F1384-92. doi: 10.1152/ajprenal.00049.2010. Epub 2010 Mar 24. Am J Physiol Renal Physiol. 2010. PMID: 20335316
-
The malformed kidney: disruption of glomerular and tubular development.Clin Genet. 1999 Nov;56(5):341-56. doi: 10.1034/j.1399-0004.1999.560502.x. Clin Genet. 1999. PMID: 10668924 Review.
-
Glomerular number and size variability and risk for kidney disease.Curr Opin Nephrol Hypertens. 2011 Jan;20(1):7-15. doi: 10.1097/MNH.0b013e3283410a7d. Curr Opin Nephrol Hypertens. 2011. PMID: 21099687 Review.
References
-
- Armstrong RA. Methods of studying the planar distributions of objects in histological sections of brain tissue. J Microsc. 2006;221:153–158. - PubMed
-
- Bourke P. Calculating the area and centroid of a polygon. 1988 http://ozviz.wasp.uwa.edu.au/~pbourke/geometry/polyarea/
-
- Brodbeck S, Englert C. Genetic determination of nephrogenesis: the Pax/Eya/Six gene network. Pediatr Nephrol. 2004;19:249–255. - PubMed
-
- Cebrian C, Borodo K, Charles J, Herzlinger D. Morphometric index of the developing murine kidney. Devel Dyn. 2004;231:601–608. - PubMed
-
- Chang H, Park C, Parvin B. Quantitative representation of three-dimensional cell culture models. 4th IEEE International Symposium on Biomedical Imaging: From Nano to Macro. 2007:89–92.
Publication types
MeSH terms
Substances
Grants and funding
LinkOut - more resources
Full Text Sources
Medical
