. 2010 Feb;19(2):202-19.
doi: 10.1002/pro.289.

Potentially amyloidogenic conformational intermediates populate the unfolding landscape of transthyretin: insights from molecular dynamics simulations

Affiliations

Potentially amyloidogenic conformational intermediates populate the unfolding landscape of transthyretin: insights from molecular dynamics simulations

J Rui Rodrigues et al. Protein Sci. 2010 Feb.

Abstract

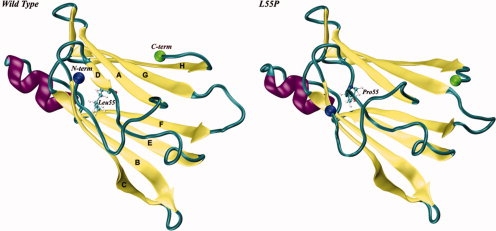
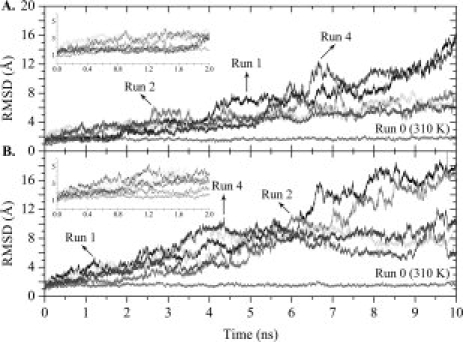
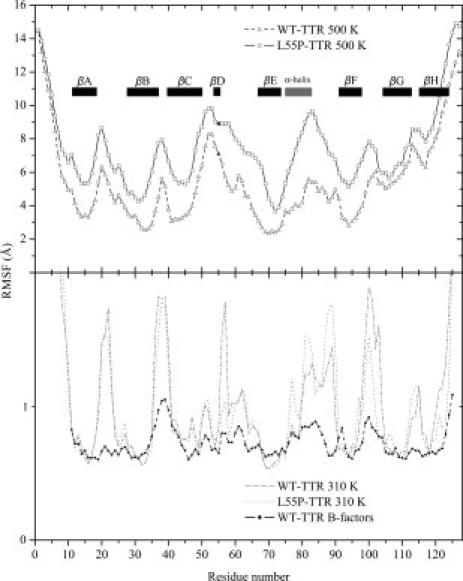
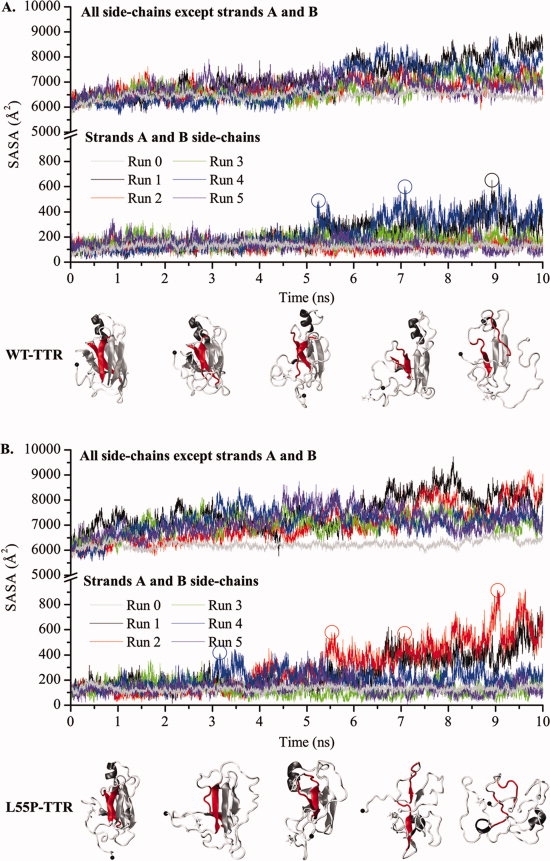
Protein aggregation into insoluble fibrillar structures known as amyloid characterizes several neurodegenerative diseases, including Alzheimer's, Huntington's and Creutzfeldt-Jakob. Transthyretin (TTR), a homotetrameric plasma protein, is known to be the causative agent of amyloid pathologies such as FAP (familial amyloid polyneuropathy), FAC (familial amyloid cardiomiopathy) and SSA (senile systemic amyloidosis). It is generally accepted that TTR tetramer dissociation and monomer partial unfolding precedes amyloid fibril formation. To explore the TTR unfolding landscape and to identify potential intermediate conformations with high tendency for amyloid formation, we have performed molecular dynamics unfolding simulations of WT-TTR and L55P-TTR, a highly amyloidogenic TTR variant. Our simulations in explicit water allow the identification of events that clearly discriminate the unfolding behavior of WT and L55P-TTR. Analysis of the simulation trajectories show that (i) the L55P monomers unfold earlier and to a larger extent than the WT; (ii) the single alpha-helix in the TTR monomer completely unfolds in most of the L55P simulations while remain folded in WT simulations; (iii) L55P forms, early in the simulations, aggregation-prone conformations characterized by full displacement of strands C and D from the main beta-sandwich core of the monomer; (iv) L55P shows, late in the simulations, severe loss of the H-bond network and consequent destabilization of the CBEF beta-sheet of the beta-sandwich; (v) WT forms aggregation-compatible conformations only late in the simulations and upon extensive unfolding of the monomer. These results clearly show that, in comparison with WT, L55P-TTR does present a much higher probability of forming transient conformations compatible with aggregation and amyloid formation.


Figures

Figure 1
Figure 1
Schematic representation of the X-ray crystal structures of wild type (on the left) and L55P (on the right) subunits of human transthyretin (TTR; PDB entries 1TTA and 5TTR, respectively). Residue 55, located in β-strand D, is represented in balls-and-sticks. The N- and C-termini are represented by two spheres. [Color figure can be viewed in the online issue, which is available at www.interscience.wiley.com.]
Figure 2
Figure 2
Variation along the simulation trajectories of the Cα atom root mean square deviation (RMSD) with respect to the crystal structure. RMSDs were calculated over all residues except the N- and C-terminal tails. Control trajectories performed at 310 K are labelled accordingly. Results for 2 × 5 unfolding simulations at 500 K for WT-TTR (A) and L55P-TTR (B) are presented. The insets represent expansions of the first 2 ns of simulation.
Figure 3
Figure 3
Cα atom root mean square fluctuation (RMSF) as a function of residue number and calculated over all trajectories at 500 K (top panel) and 310 K (bottom panel) for WT-TTR (hollow triangles) and L55P-TTR (hollow squares). Residue 55 is colored in black. All 127 residues were considered and the secondary structure motifs are identified by eight black rectangles corresponding to the β-strands, and a gray rectangle corresponding to the α-helix. The line with black circles (bottom panel) represents the fluctuations derived from the crystallographic B-factors of WT-TTR (PDB entry 2QGB). For clarity, RMSF values in the top and bottom panels were represented with different scales.
Figure 4
Figure 4
Variation of the solvent accessible surface area (SASA) of the monomers' side-chains along MD simulations of WT-TTR (A) and L55P-TTR (B). The SASA of residues located in β-strands A and B (lower panels) and of all other residues (upper panels) are represented separately. Runs 0 are control simulations performed at 310 K. All other simulations are unfolding simulations performed at 500 K. Protein conformations shown underneath the plots correspond to SASA increases at different stages of the simulations. Strands A and B are highlighted in red.
Figure 5
Figure 5
Relative difference in SASA per residue (% of SASA difference) between L55P-TTR and WT-TTR, across all sampled conformations. The secondary structure motifs in native TTR are identified by eight black rectangles corresponding to the beta-strands, and a gray rectangle corresponding to the alpha-helix. Additionally, residue 55 and all other residues displaying exceptionally high SASA increases are labeled.
Figure 6
Figure 6
Secondary structure variation along MD simulations of WT- and L55P-TTR. (A): WT-TTR, control run (at 310 K); (B–F): WT-TTR, runs 1 to 5; (G): L55P-TTR, control run (at 310 K); (H–L): L55P-TTR, runs 1 to 5. All runs, except the control runs, were performed at 500 K. Secondary structure was assigned with the program STRIDE. Residues in β-sheet are shown in gray, helical motifs are represented in dark gray, and residues in nonregular or other secondary structure are shown in white.
Figure 7
Figure 7
Persistence of native contacts along MD simulations of WT-TTR (on the left) and L55P-TTR (on the right), for the control runs at 310 K (panels A and G) and for unfolding runs 1 to 5, at 500 K (panels B–F and H–L). Black traces represent the total number of enduring native contacts along the simulations. The light gray matrices on the background illustrate the persistence of each contact along the simulation.
Figure 8
Figure 8
Minimum distance conformations (MDC) for each of the 10 clusters obtained by hierarchical agglomerative clustering for WT-TTR (A) and L55P-TTR (B). The residue at the mutation site is represented with spheres: Leu55 is colored in green and Pro55 in light green. Residues undergoing larger increases in SASA throughout the L55P-TTR simulations are represented as orange spheres; Phe33—showing the highest increase — is represented in red. Residues belonging to β-strands A and B and displaying significant increases in SASA are represented with gray dots. The orientation of all models was obtained by least-squares fitting to the initial crystal model of WT-TTR shown in Figure 1, except MDCs 7 and 9 which are slightly rotated from the other conformations.

Similar articles

Cited by

References

    1. Chiti F, Dobson CM. Protein misfolding, functional amyloid, and human disease. Annu Rev Biochem. 2006;75:333–366. - PubMed
    1. Brito RMM, Damas AM, Saraiva MJ. Amyloid formation by transthyretfrom protein stability to protein aggregation. Curr Med Chem Immunol Endocr Metab Agents. 2003;3:349–360.
    1. Andrade C. A peculiar form of peripheral neuropathy. Familial atypical generalized amyloidosis with special involvement of peripheral nerves. Brain. 1952;75:408–427. - PubMed
    1. Costa PP, Figueira AS, Bravo SR. Amyloid fibril protein related to prealbumin in familial amyloidotic polyneuropathy. Proc Natl Acad Sci USA. 1978;75:4499–4503. - PMC - PubMed
    1. Connors LH, Richardson AM, Theberge R, Costello CE. Tabulation of transthyretin (TTR) variants as of 1/1/2000. Proc Natl Acad Sci USA. 2000;7:54–69. - PubMed

Publication types