. 2009 Dec;50(6):1827-38.
doi: 10.1002/hep.23229.

The plasma lipidomic signature of nonalcoholic steatohepatitis

Affiliations

The plasma lipidomic signature of nonalcoholic steatohepatitis

Puneet Puri et al. Hepatology. 2009 Dec.

Abstract

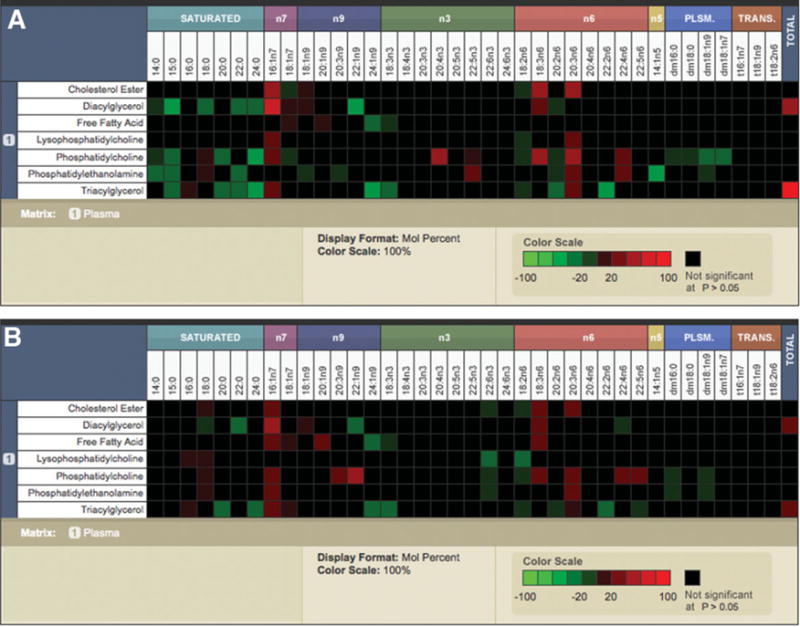
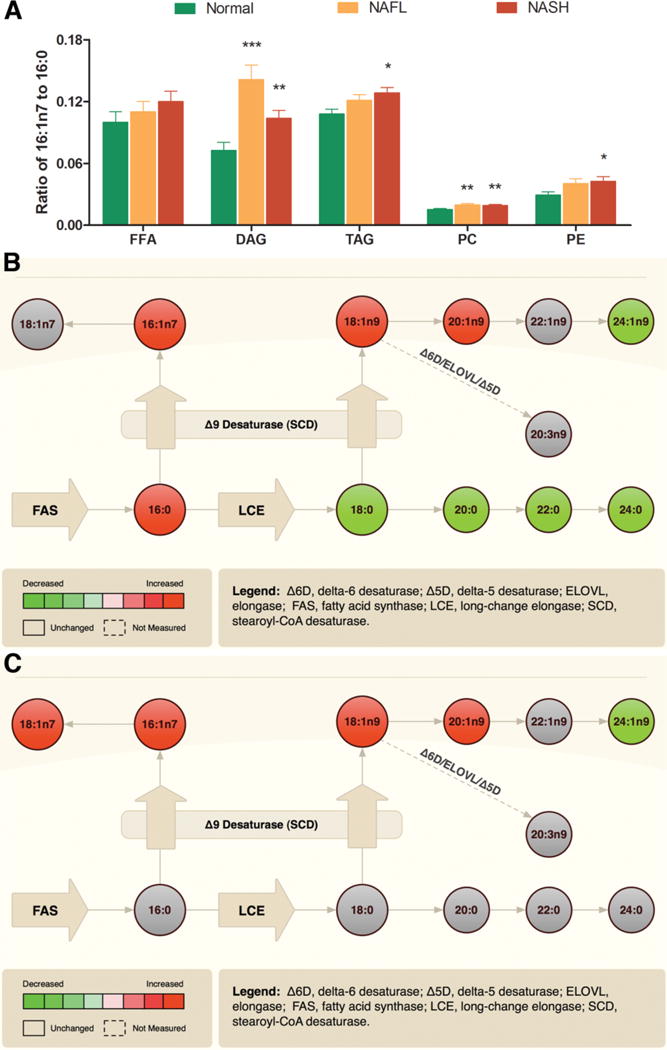
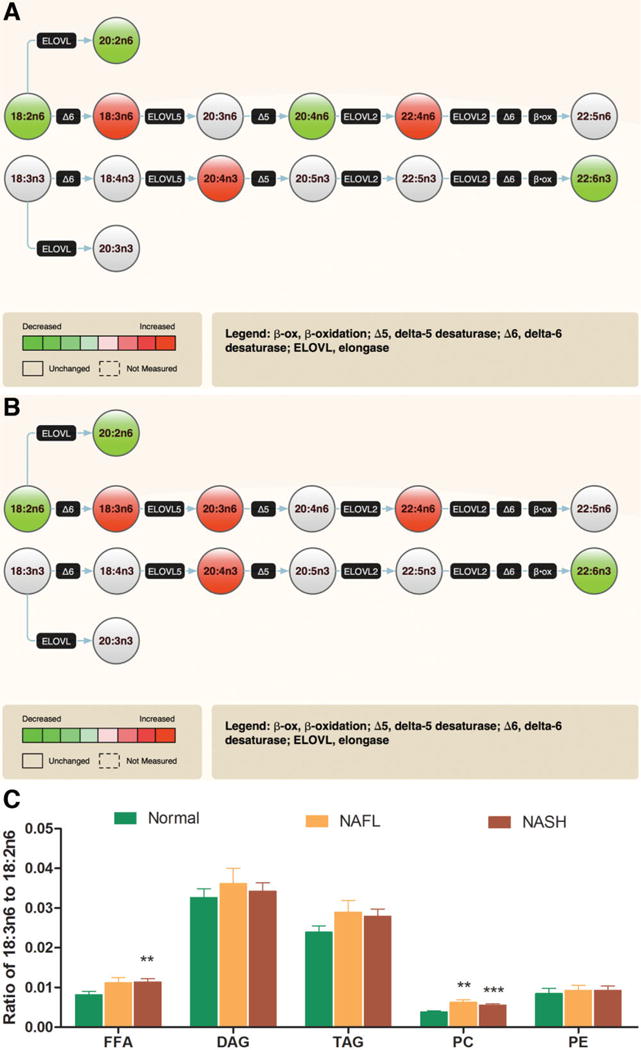
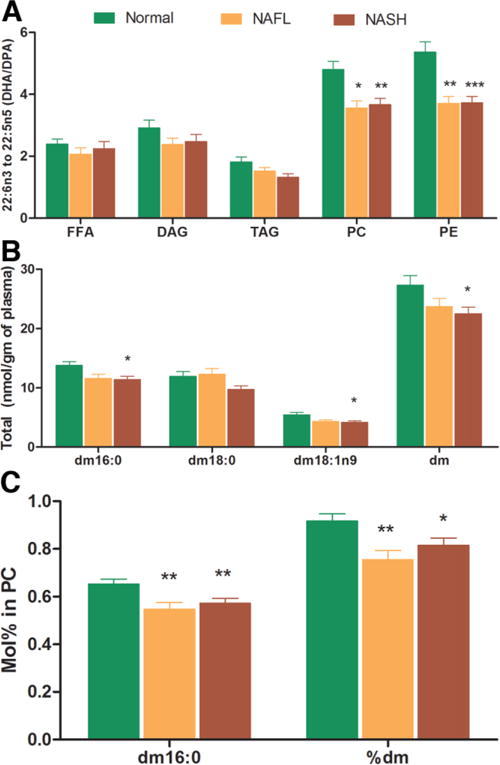
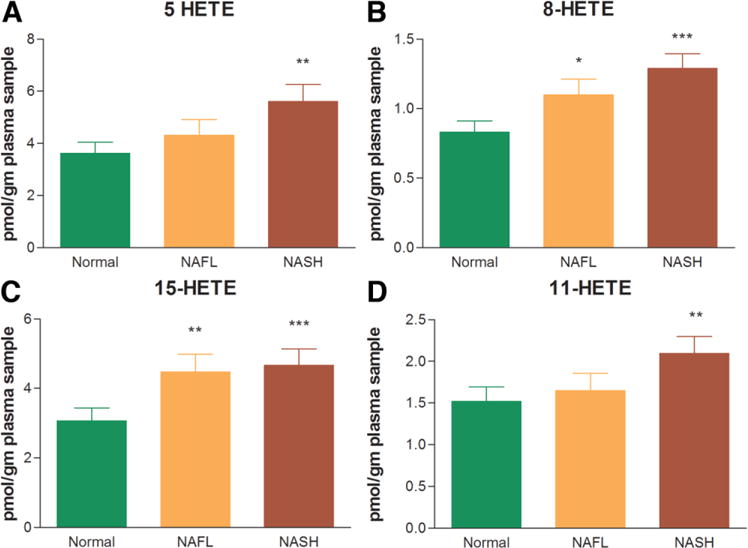
Specific alterations in hepatic lipid composition characterize the spectrum of nonalcoholic fatty liver disease (NAFLD), which extends from nonalcoholic fatty liver (NAFL) to nonalcoholic steatohepatitis (NASH). However, the plasma lipidome of NAFLD and whether NASH has a distinct plasma lipidomic signature are unknown. A comprehensive analysis of plasma lipids and eicosanoid metabolites quantified by mass spectrometry was performed in NAFL (n = 25) and NASH (n = 50) subjects and compared with lean normal controls (n = 50). The key findings include significantly increased total plasma monounsaturated fatty acids driven by palmitoleic (16:1 n7) and oleic (18:1 n9) acids content (P < 0.01 for both acids in both NAFL and NASH). The levels of palmitoleic acid, oleic acid, and palmitoleic acid to palmitic acid (16:0) ratio were significantly increased in NAFLD across multiple lipid classes. Linoleic acid (8:2n6) was decreased (P < 0.05), with a concomitant increase in gamma-linolenic (18:3n6) and dihomo gamma-linolenic (20:3n6) acids in both NAFL and NASH (P < 0.001 for most lipid classes). The docosahexanoic acid (22:6 n3) to docosapentenoic acid (22:5n3) ratio was significantly decreased within phosphatidylcholine (PC), and phosphatidylethanolamine (PE) pools, which was most marked in NASH subjects (P < 0.01 for PC and P < 0.001 for PE). The total plasmalogen levels were significantly decreased in NASH compared with controls (P < 0.05). A stepwise increase in lipoxygenase (LOX) metabolites 5(S)-hydroxyeicosatetraenoic acid (5-HETE), 8-HETE, and 15-HETE characterized progression from normal to NAFL to NASH. The level of 11-HETE, a nonenzymatic oxidation product of arachidonic (20:4) acid, was significantly increased in NASH only.

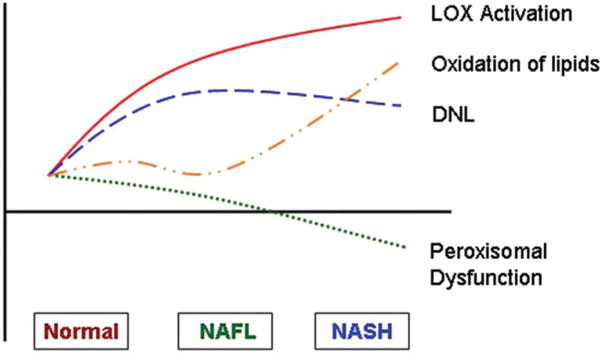
Conclusions: Although increased lipogenesis, desaturases, and LOX activities characterize NAFL and NASH, impaired peroxisomal polyunsaturated fatty acid (PUFA) metabolism and nonenzymatic oxidation is associated with progression to NASH.


Conflict of interest statement

Potential conflict of interest: Dr. Wiest is a consultant for and Dr. Watkins owns stock in Lipomics.

Figures

Fig. 1
Fig. 1
The surveyor heat maps demonstrate the distribution of different fatty acids (shown in columns) within individual lipid classes (shown in rows) displayed as mole percent data. The significant increases are displayed in red, and significant decreases are shown in green. The fatty acid composition without a significant change is indicated in black. Comparisons of NAFL versus normal (A) and NASH versus normal (B) are shown. Trans-fatty acids were not measured. The key to fatty acids: myristic acid (14:0), pentadecanoic acid (15:0), palmitic acid (16:0), stearic acid (18:0), arachidic acid (20:0), behenic acid (22:0), lignoceric acid (24:0), myristoleic acid (14:1n5), palmitoleic acid (16:1n7), vaccenic acid (18:1n7), oleic acid (18:1n9), eicosanoic acid (20:1n9), mead acid (20:3n9), erucic acid (22:1n9), nervonic acid (24:1n9), linoleic acid (18:2n6), γ-linolenic acid (18:3n6), eicosadienoic acid (20:2n6), Homo-γ-linolenic acid (20:3n6), arachidonic acid (20:4n6), docosadienoic acid (22:2n6), adrenic acid (22:4n6), docosapentaenoic acid (22:5n6), α-linolenic acid (18:3n3), stearidonic acid (18:4n3), eicosatrienoic acid (20:3n3), eicosatetraenoic acid (20:4n3), eicosapentaenoic acid (20:5n3), docosapentaenoic acid (22:5n3), docosahexaenoic acid (22:6n3), tetracosahexaenoic acid (24:6n3), dimethyl 16:0 (dm16:0), dimethyl 18:0 (dm18:0), dimethyl 18:1n7 (dm18:1n7), dimethyl 18:1n9 (dm18:1n9).
Fig. 2
Fig. 2
NAFLD is associated with increased de novo lipogenesis. (A) Significantly increased palmitoleic acid (16:1n7) to palmitic acid (16:0) ratio in several lipid classes among subjects with NAFLD. A composite fatty acid methyl ester data from all lipid classes reflective of monounsaturated fatty acids metabolism is displayed as pathway maps. The activity of stearoyl CoA desaturase (Δ9 SCD) and other enzymes are displayed showing comparisons of NAFL versus normal (B) and NASH versus normal (C), respectively. The significant increases are displayed in red, and significant decreases are shown in green. The nonsignificant changes are shown in gray. The key to individual acids is as described in Fig. 1. Data in bar graph expressed as means ± SEM. *P < 0.05; **P < 0.01; ***P < 0.001 versus normal.
Fig. 3
Fig. 3
NAFLD is associated with increased Δ 6 desaturase activity. The composite fatty acid methyl esters data from all lipid classes reflective of polyunsaturated fatty acid (PUFA) metabolism is displayed as pathway maps (A: NAFL versus Normal, and B: NASH versus normal). Significant changes are shown as red for increase or green for decrease; gray color reflects no significant change. (C) A generalized trend is seen for an increase in γ-linolenic acid (GLA, 18:3n6) to linoleic acid (18:2n6) ratios with significant changes in free fatty acid (FFA) and phosphatidylcholine (PC) pools. This is indicative of increased Δ 6 desaturase (Δ6DS) activity, which is also reflected in (A) and (B),1 with increased product (GLA) shown as red and decreased precursor (linoleic acid) shown as green. In addition to changes in other fatty acids, the concentration of docosahexaenoic acid (DHA, 22:6n3) is also decreased in both NAFL (A) and NASH (B). Data in bar graph expressed as means ± SEM. *P < 0.05; **P < 0.01; ***P < 0.001 versus normal.
Fig. 4
Fig. 4
NAFLD is associated with peroxisomal dysfunction. The docosahexaenoic acid (DHA, 22:6n3) to docosapentaenoic acid (DPA, 22: 5n3) ratio among different lipid classes and changes in plasmalogen levels are represented graphically. There is a generalized trend for decrease in DHA:DPA ratio, which was significant for phosphatidylcholine (PC) and phosphatidylethanolamine (PE) pools (A). Similarly, there was a stepwise decrease in plasmalogen levels (nmol/g of sample) from normal to NAFL to NASH that was statistically significant for total plasmalogen (dm), dm 16:0, and dm 18:1n9 content in NASH only (B). The plasmalogen concentration within lipid classes (mol%) was significantly decreased for dm and dm16:0 within PC pool in NAFLD (C). These figures suggest that NAFLD is associated with peroxisomal dysfunction, which is most marked in NASH. Data expressed as means ± SEM. *P < 0.05; **P < 0.01; ***P < 0.001 versus normal.
Fig. 5
Fig. 5
The eicosanoid metabolites of the lipoxygenase pathway. The levels of 5(S)-hydroxyeicosatetraenoic acid (5-HETE), 8-HETE, and 15-HETE (A-C) increased in a stepwise manner from normal to NAFL to NASH. These were markedly elevated in those with NASH relative to the lean normal control subjects. The levels of 11-HETE, a non-enzymatic oxidation product of arachidonic (20:4 n6) acid, was also significantly increased in NASH only (D). Data expressed as means ± SEM. *P < 0.05; **P < 0.01; ***P < 0.001 versus normal.
Fig. 6
Fig. 6
The proposed model of “circulating lipidome” in human NAFL and NASH. The development of NAFL is accompanied by increased de novo lipogenesis (DNL), Δ6 desaturase, and lipoxygenase (LOX) activity. With progression to NASH, the lipogenic activity levels off or declines modestly while the LOX activity increases. Simultaneously, there is a decrease in peroxisomal function and increase in levels of products of nonenzymatic oxidation of arachidonic (20:4n6) acid.

Comment in

References

    1. Browning JD, Szczepaniak LS, Dobbins R, Nuremberg P, Horton JD, Cohen JC, et al. Prevalence of hepatic steatosis in an urban population in the United States: impact of ethnicity. Hepatology. 2004;40:1387–1395. - PubMed
    1. Contos MJ, Sanyal AJ. The clinicopathologic spectrum and management of nonalcoholic fatty liver disease. Adv Anat Pathol. 2002;9:37–51. - PubMed
    1. Ekstedt M, Franzen LE, Mathiesen UL, Thorelius L, Holmqvist M, Bodemar G, et al. Long-term follow-up of patients with NAFLD and elevated liver enzymes. Hepatology. 2006;44:865–873. - PubMed
    1. Ludwig J, Viggiano TR, McGill DB, Oh BJ. Nonalcoholic steatohepatitis: Mayo Clinic experiences with a hitherto unnamed disease. Mayo Clin Proc. 1980;55:434–438. - PubMed
    1. Sanyal AJ, Campbell-Sargent C, Mirshahi F, Rizzo WB, Contos MJ, Sterling RK, et al. Nonalcoholic steatohepatitis: association of insulin resistance and mitochondrial abnormalities. Gastroenterology. 2001;120:1183–1192. - PubMed

Publication types