

doi: 10.1002/0471140864.ps1706s58.
Investigating solution-phase protein structure and dynamics by hydrogen exchange mass spectrometry
Affiliations
- PMID: 19937720
- PMCID: PMC2844867
- DOI: 10.1002/0471140864.ps1706s58
Item in Clipboard
Investigating solution-phase protein structure and dynamics by hydrogen exchange mass spectrometry
Curr Protoc Protein Sci.
2009 Nov.
Abstract
By taking advantage of labeling methods such as hydrogen exchange (HX), many details about protein conformation, dynamics, and interactions can be revealed by mass spectrometry. In this unit, hydrogen exchange theory is discussed as it applies to HX-MS protocols, the practice of HX-MS including data analysis and interpretation is explained in detail, and recent advancements in technology which greatly increase the depth of information gained from the technique are highlighted.
Figures
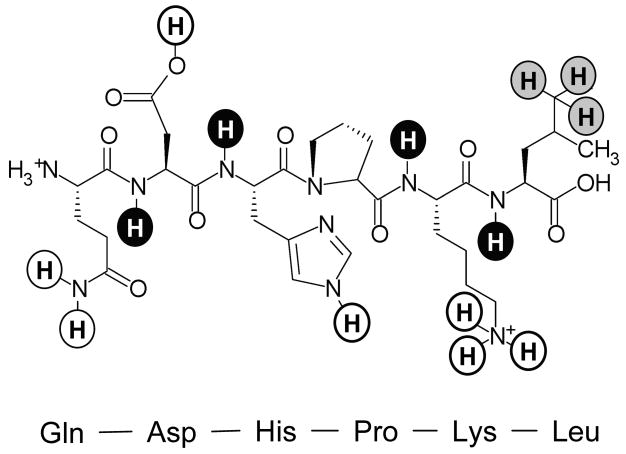
Types of hydrogens in proteins. The six residue peptide Gln-Asp-His-Pro-Lys-Leu illustrates backbone amide hydrogens (black), non-exchangeable hydrogens bonded to carbon (grey) and exchangeable hydrogens which cannot be monitored with HX MS because their rates are too fast (white). In this six residue peptide, there are only four backbone amide hydrogens that can be monitored by MS as proline does not have a backbone amide hydrogen and the exchange rates of the N-terminus amide hydrogens are similar to those of hydrogens in sidechains, such that they cannot be measured by MS.
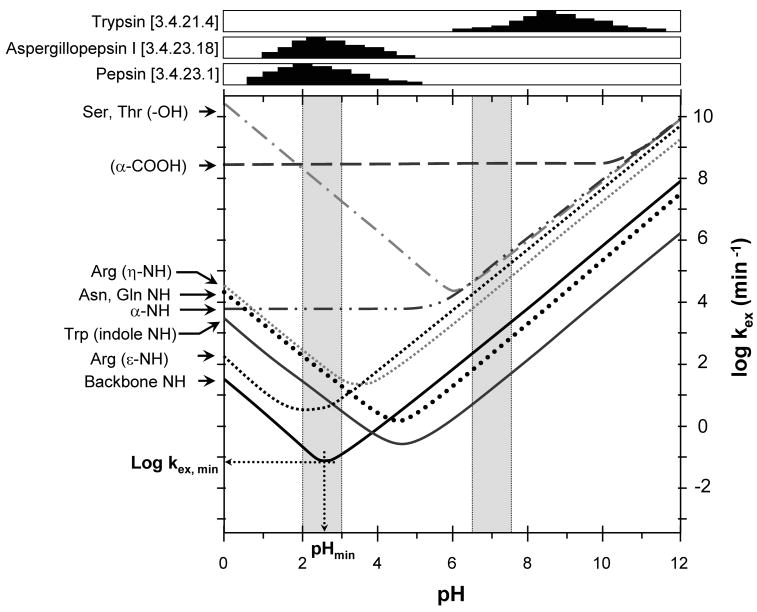
Exchange rates for various types of hydrogens as a function of pH. The data shown are for hydrogens in unstructured peptides. Labeling (pH ~7.0) and quench (pH ~2.5) regions are highlighted in grey. Activity (arbitrary units) of trypsin and the acid proteases aspergillopepsin I and porcine pepsin (EC numbers are noted) as a function of pH are shown at the top [activity values derived from: aspergillopepsin I – (Tello-Solis and Hernandez-Arana, 1995), pepsin – (Bohak, 1969; Brier et al., 2007), trypsin – (Woodard et al., 2003)]. A full bar represents 100% activity. Note that pepsin activity is in the pH range where the HX rate for backbone amide hydrogens is at its minimum. This figure was adapted from (Brier and Engen, 2008) and is used with permission.
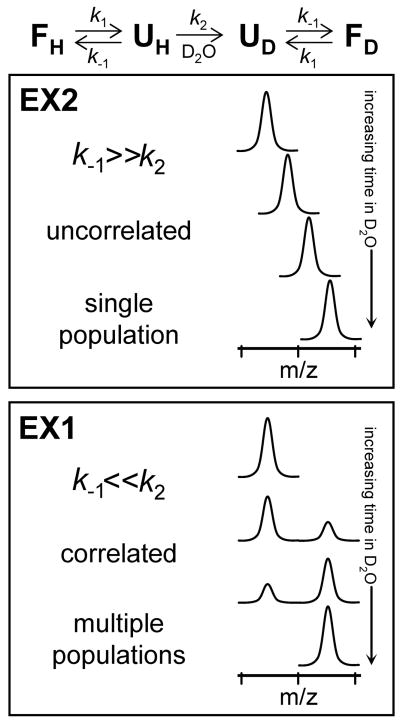
Protein unfolding and deuterium labeling kinetics in hydrogen exchange mass spectrometry. The folding/unfolding and labeling scheme (Equation 3) is shown at the top and resulting spectra for both EX2 and EX1 kinetics are shown below. This figure is reproduced from (Weis et al., 2006b) with permission.
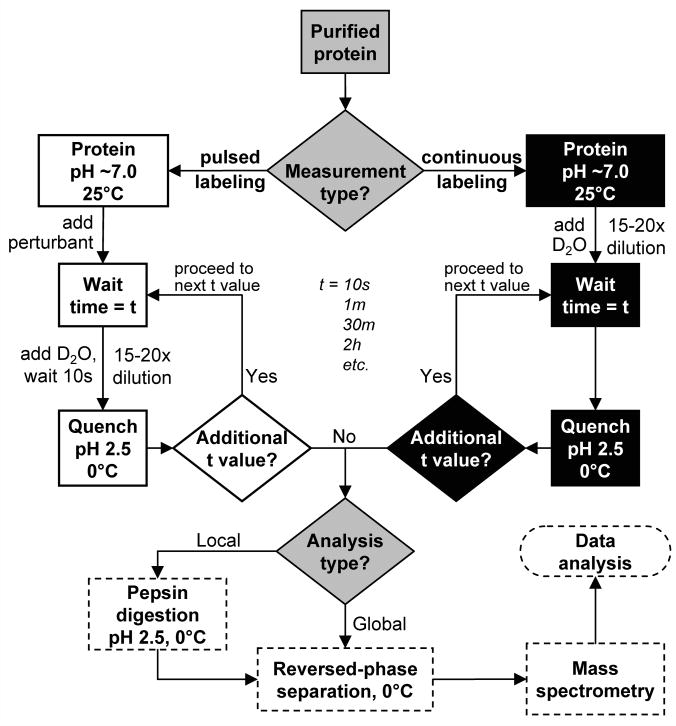
Flow chart for hydrogen exchange mass spectrometry. Decision points are indicated with diamonds. The shading indicates which type of work is being performed: continuous labeling (black), pulsed labeling (white) and mass and data analysis (dashed border).
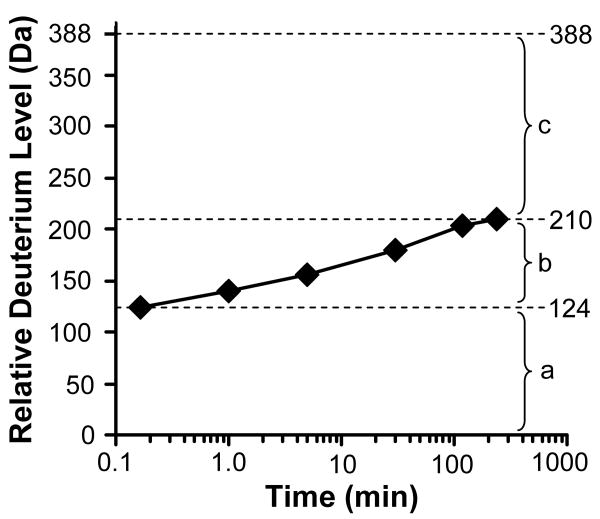
Example data for deuterium exchange into an intact protein. The maximum of the y-axis is equal to the maximum number of exchangeable backbone amide hydrogens. Three general regions can be defined in a graph of this type. Region (a) represents those amide hydrogens that exchanged before the first time point. These amide hydrogens are typically highly solvent exposed and not engaged in intraprotein hydrogen bonding. In region (b), the amide hydrogens that become exchange competent either through EX2 or EX1 kinetics (see Figure 3) become deuterated. These amide hydrogens are generally those that are in dynamic regions where local unfolding can occur during the deuteration time course. Region (c) contains those amide hydrogens that did not exchange even after the longest exchange timepoint in the experiment, here 4 hours. These amide hydrogens that are slow to exchange are often located within the core of the protein protected from solvent or are engaged in strong hydrogen bonds in structural elements.
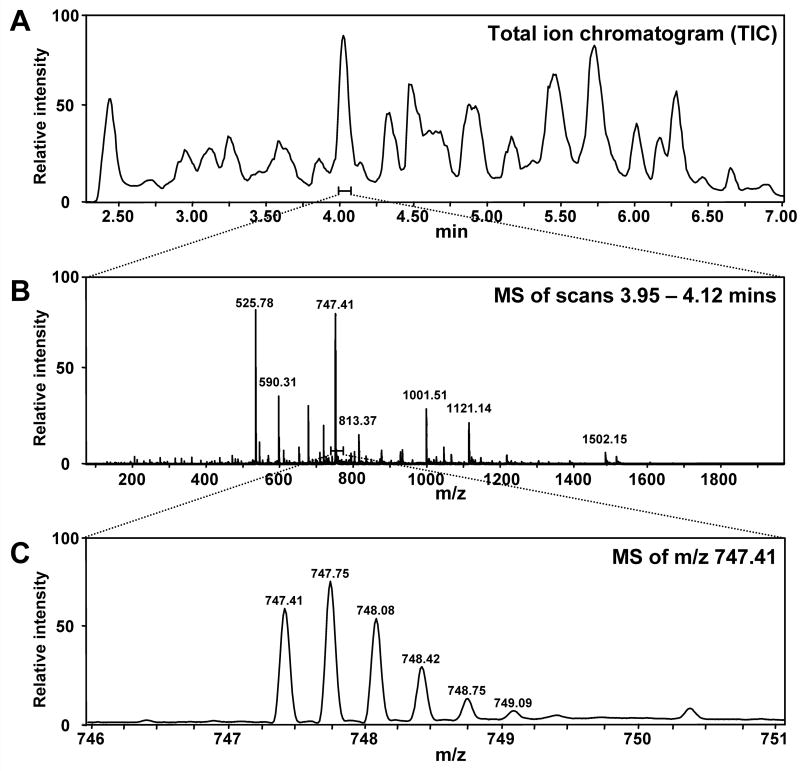
Representative chromatograms and electrospray mass spectra to illustrate the LC separation and mass spectra for local analysis. A. Typical UPLC trace for separation of the peptic peptides from a 27 kDa protein [methods described in (Wales et al., 2008)]. The amount of time required for separation of the peptides is relatively short (~5 min). B. Full scan mass spectrum of the ions eluting between 3.95-4.12 minutes. While there are multiple ions, they are well resolved in the m/z scale. C. Zoom of the ion at m/z 747.41 illustrating the typical isotopic pattern and mass resolution observed. These results were obtained with a Waters Q-Tof Premier.
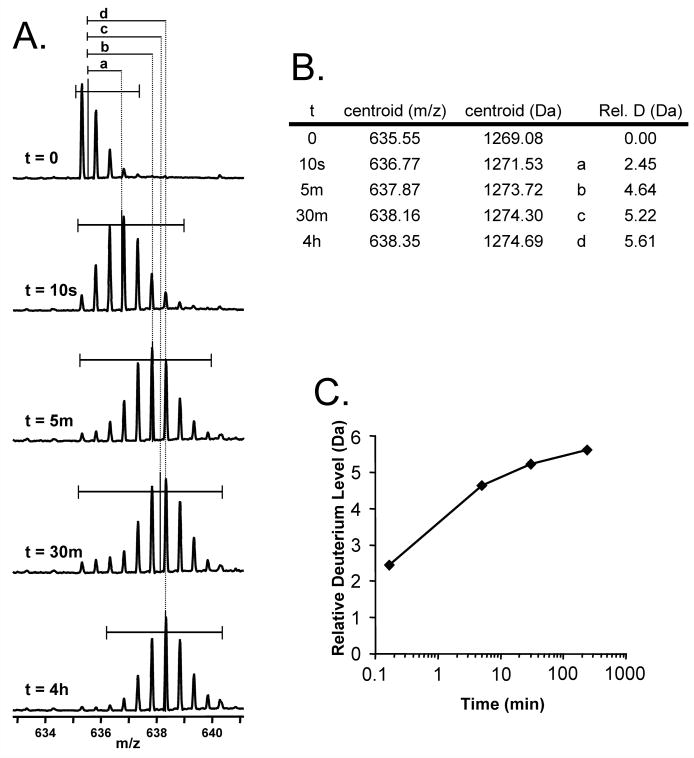
An illustration of the steps required to convert the data in raw mass spectra from a time course of deuteration into a deuterium uptake graph. A. Raw mass spectra for an ion at m/z 635.32, produced by labeling a protein for a certain time, digesting the protein with pepsin and then carrying out UPLC/MS (as shown in Figure 6). The time spent in deuterium is indicated, with the undeuterated protein at the top. The horizontal bars indicate what part of each mass spectrum was used to determine the centroid mass of each isotopic distribution. The centroid values are named a,b,c, or d as shown. B. A table that tallies the time spent in deuterium, the centroid value and the mass increase of each time point relative to the undeuterated control. C. A graph of the data in panel B.
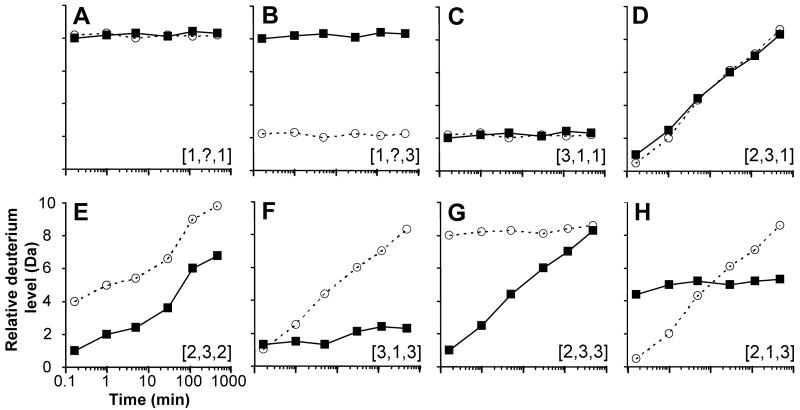
Peptide hydrogen exchange data that may be encountered. Eight regions (A-H) from a hypothetical protein that has different physiological conformation and dynamics are described for wild-type protein by itself (solid symbols, solid lines) and the same protein when stimulated (open symbols, dotted lines). Stimulation means one of many things, including: ligand binding, mutation, activation, post-translational modification, protein-protein interactions, denaturant, etc. In these graphs, the maximum number of exchangeable hydrogens is plotted as the maximum of the y-axis. Each panel has been assigned a ranking with the following format: [x,y,z,] where x is the protection/structure, y is the dynamics, and z is the change upon stimulation. A rank of 1 is low, 2 is medium and 3 is high. The rank is based on the wild-type protein transitioning to the stimulated form. The details of each panel are discussed in the text.
References
-
- Bai Y, Milne JS, Mayne L, Englander SW. Protein stability parameters measured by hydrogen exchange. Proteins. 1994;20(1):4–14. - PubMed
-
- Bohak Z. Purification and characterization of chicken pepsinogen and chicken pepsin. J Biol Chem. 1969;244(17):4638–4648. - PubMed
-
- Brier S, Engen JR. Hydrogen exchange mass spectrometry: Principles and capabilities. In: Chance M, editor. Mass spectrometry analysis for protein-protein interactions and dynamics. New York: Wiley-Blackwell; 2008. pp. 11–43.
Publication types
MeSH terms
Substances
Grants and funding
LinkOut - more resources
Full Text Sources
