

Neuronal network pharmacodynamics of GABAergic modulation in the human cortex determined using pharmaco-magnetoencephalography
- PMID: 19937723
- PMCID: PMC3179593
- DOI: 10.1002/hbm.20889
Neuronal network pharmacodynamics of GABAergic modulation in the human cortex determined using pharmaco-magnetoencephalography
Abstract
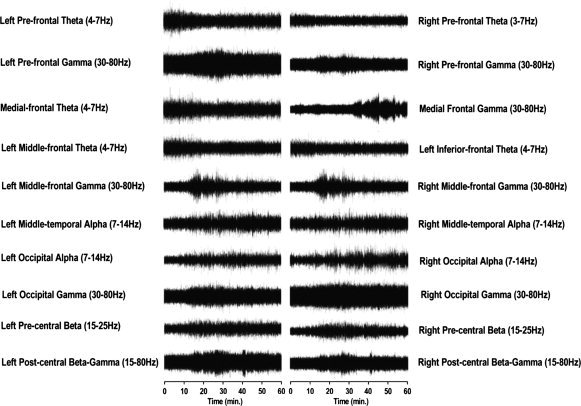
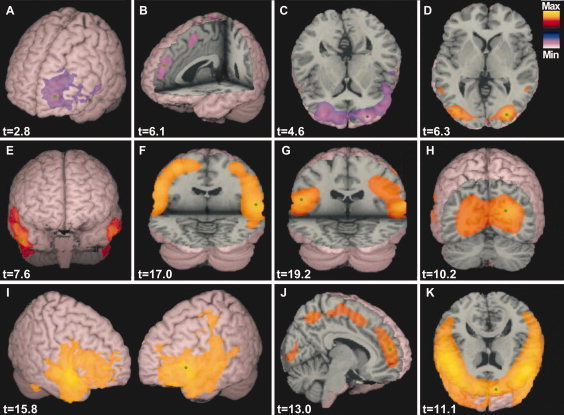
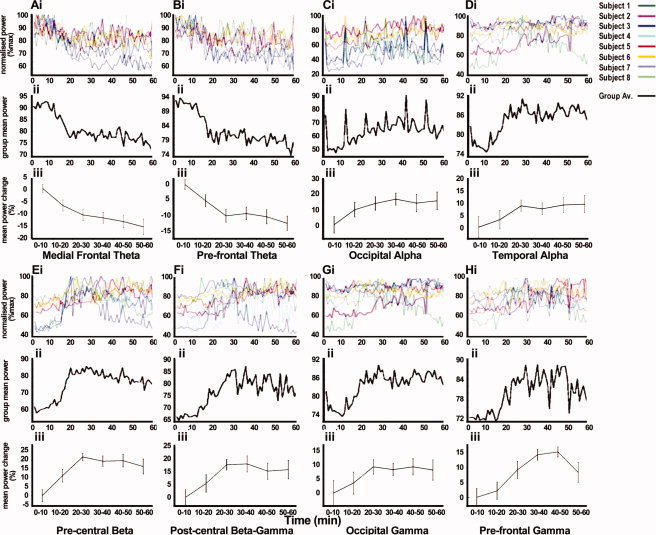
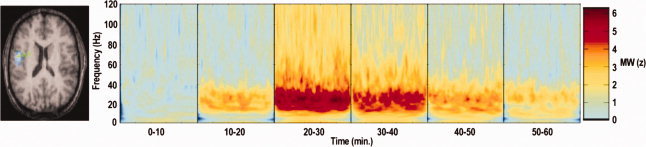
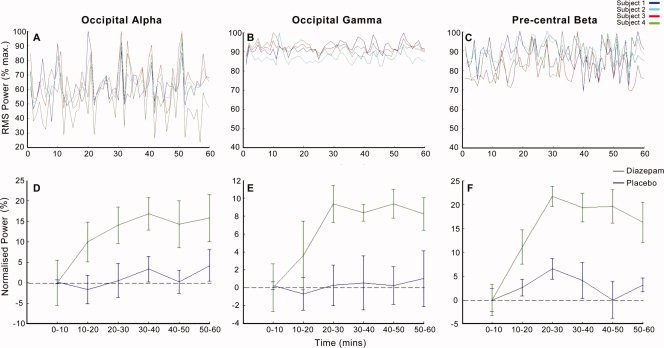
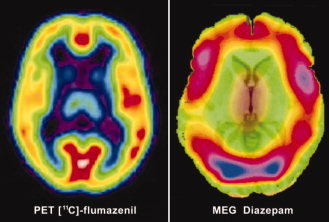
Neuronal network oscillations are a unifying phenomenon in neuroscience research, with comparable measurements across scales and species. Cortical oscillations are of central importance in the characterization of neuronal network function in health and disease and are influential in effective drug development. Whilst animal in vitro and in vivo electrophysiology is able to characterize pharmacologically induced modulations in neuronal activity, present human counterparts have spatial and temporal limitations. Consequently, the potential applications for a human equivalent are extensive. Here, we demonstrate a novel implementation of contemporary neuroimaging methods called pharmaco-magnetoencephalography. This approach determines the spatial profile of neuronal network oscillatory power change across the cortex following drug administration and reconstructs the time course of these modulations at focal regions of interest. As a proof of concept, we characterize the nonspecific GABAergic modulator diazepam, which has a broad range of therapeutic applications. We demonstrate that diazepam variously modulates theta (4-7 Hz), alpha (7-14 Hz), beta (15-25 Hz), and gamma (30-80 Hz) frequency oscillations in specific regions of the cortex, with a pharmacodynamic profile consistent with that of drug uptake. We examine the relevance of these results with regard to the spatial and temporal observations from other modalities and the various therapeutic consequences of diazepam and discuss the potential applications of such an approach in terms of drug development and translational neuroscience.
Copyright 2009 Wiley-Liss, Inc.
Figures
Similar articles
-
The role of GABAergic modulation in motor function related neuronal network activity.Neuroimage. 2011 Jun 1;56(3):1506-10. doi: 10.1016/j.neuroimage.2011.02.025. Epub 2011 Feb 12. Neuroimage. 2011. PMID: 21320607
-
Neuronal mechanisms of the anoxia-induced network oscillations in the rat hippocampus in vitro.J Physiol. 2001 Oct 15;536(Pt 2):521-31. doi: 10.1111/j.1469-7793.2001.0521c.xd. J Physiol. 2001. PMID: 11600686 Free PMC article.
-
Pharmacologically induced and stimulus evoked rhythmic neuronal oscillatory activity in the primary motor cortex in vitro.Neuroscience. 2008 Jan 24;151(2):386-95. doi: 10.1016/j.neuroscience.2007.10.021. Epub 2007 Nov 1. Neuroscience. 2008. PMID: 18063484
-
GABAergic Modulation in Movement Related Oscillatory Activity: A Review of the Effect Pharmacologically and with Aging.Tremor Other Hyperkinet Mov (N Y). 2021 Nov 10;11:48. doi: 10.5334/tohm.655. eCollection 2021. Tremor Other Hyperkinet Mov (N Y). 2021. PMID: 34824891 Free PMC article. Review.
-
Alterations of cortical GABA neurons and network oscillations in schizophrenia.Curr Psychiatry Rep. 2010 Aug;12(4):335-44. doi: 10.1007/s11920-010-0124-8. Curr Psychiatry Rep. 2010. PMID: 20556669 Free PMC article. Review.
Cited by
-
Post-Movement Beta Synchrony Inhibits Cortical Excitability.Brain Sci. 2024 Sep 26;14(10):970. doi: 10.3390/brainsci14100970. Brain Sci. 2024. PMID: 39451984 Free PMC article.
-
Beta band frequency differences between motor and frontal cortices in reaching movements.IEEE Int Conf Rehabil Robot. 2019 Jun;2019:1254-1259. doi: 10.1109/ICORR.2019.8779373. IEEE Int Conf Rehabil Robot. 2019. PMID: 31374801 Free PMC article.
-
Neurophysiological oscillatory markers of hypoalgesia in conditioned pain modulation.Pain Rep. 2023 Oct 23;8(6):e1096. doi: 10.1097/PR9.0000000000001096. eCollection 2023 Dec. Pain Rep. 2023. PMID: 37881810 Free PMC article.
-
Relating MEG measured motor cortical oscillations to resting γ-aminobutyric acid (GABA) concentration.Neuroimage. 2011 Mar 15;55(2):616-21. doi: 10.1016/j.neuroimage.2010.12.077. Epub 2011 Jan 6. Neuroimage. 2011. PMID: 21215806 Free PMC article.
-
Effects of alprazolam on cortical activity and tremors in patients with essential tremor.PLoS One. 2014 Mar 25;9(3):e93159. doi: 10.1371/journal.pone.0093159. eCollection 2014. PLoS One. 2014. PMID: 24667763 Free PMC article.
References
-
- Adjamian P, Barnes GR, Hillebrand A, Holliday IE, Singh KD, Furlong PL, Harrington E, Barclay CW, Route PJG ( 2004a): Co‐registration of magnetoencephalography with magnetic resonance imaging using bite‐bar‐based fiducials and surface‐matching. Clin Neurophysiol 115: 691–698. - PubMed
-
- Adjamian P, Holliday IE, Barnes GR, Hillebrand A, Hadjipapas A, Singh KD ( 2004b): Induced visual illusions and gamma oscillations in human primary visual cortex. Eur J Neurosci 20: 587–592. - PubMed
-
- Aftanas LI, Varlamov AA, Pavlov SV, Makhnev VP, Reva NV ( 2002): Time‐dependent cortical asymmetries induced by emotional arousal: EEG analysis of event‐related synchronization and desynchronization in individually defined frequency bands. Int J Psychophysiol 44: 67–82. - PubMed
-
- Ahveninen J, Lin FH, Kivisaari R, Autti T, Hamalainen M, Stufflebeam S, Belliveau JW, Kahkonen S ( 2007): MRI‐constrained spectral imaging of benzodiazepine modulation of spontaneous neuromagnetic activity in human cortex. Neuroimage 35: 577–582. - PubMed
-
- Alldredge BK, Gelb AM, Isaacs SM, Corry MD, Allen F, Ulrich S, Gottwald MD, O'Neil N, Neuhaus JM, Segal MR, Lowenstein DH ( 2001): A comparison of lorazepam, diazepam, and placebo for the treatment of out‐of‐hospital status epilepticus. N Eng J Med 345: 631–637. - PubMed
MeSH terms
Substances
Grants and funding
LinkOut - more resources
Full Text Sources
Research Materials
