

Genetic and epigenetic characteristics of gastric cancers with JC virus T-antigen
- PMID: 19938198
- PMCID: PMC2785062
- DOI: 10.3748/wjg.15.5579
Genetic and epigenetic characteristics of gastric cancers with JC virus T-antigen
Abstract
Aim: To clarify the significance of JC virus (JCV) T-antigen (T-Ag) expression in human gastric cancer.
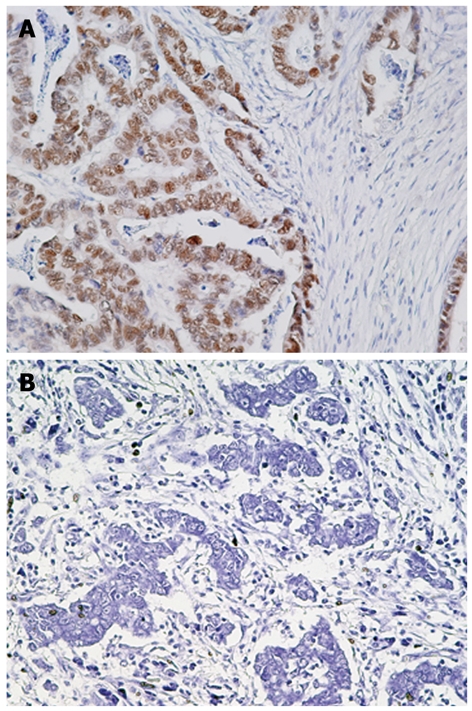
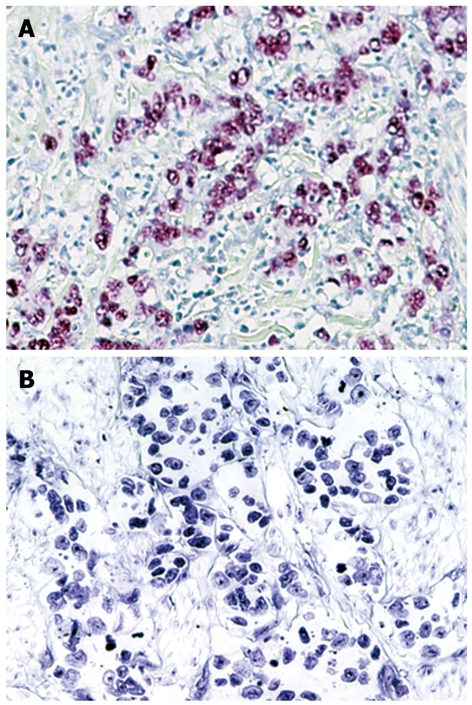
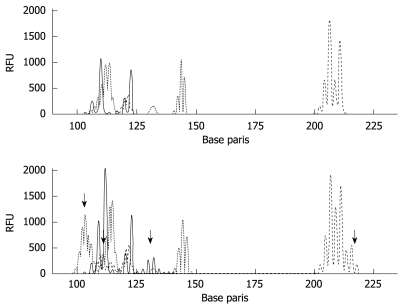
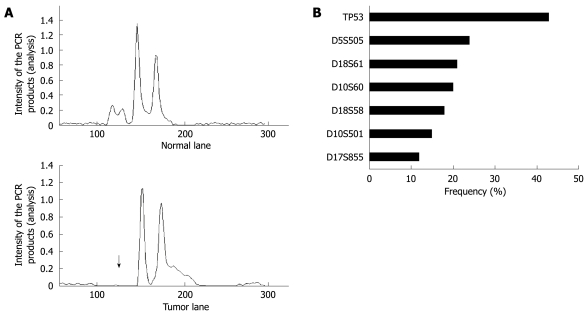
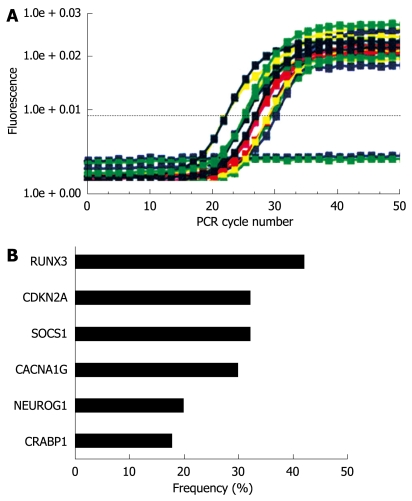
Methods: We investigated the relationship between T-Ag detected by immunohistochemistry and Epstein-Barr virus (EBV) infection, microsatellite instability (MSI), and genetic and epigenetic alterations in gastric cancers. Mutations in the p53, beta-catenin, KRAS, BRAF, PIK3CA genes were analyzed by polymerase chain reaction (PCR)-single strand conformation polymorphism and DNA sequencing. Allelic losses were determined by PCR at 7 microsatellite loci. Aberrant DNA methylation was analyzed by MethyLight assay.
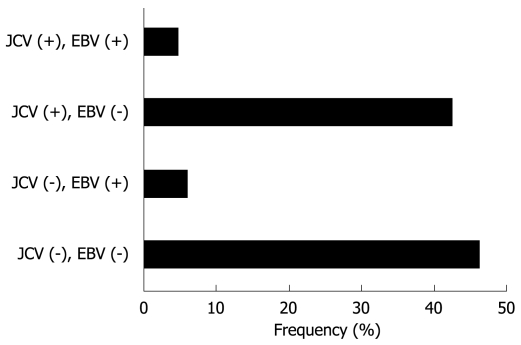
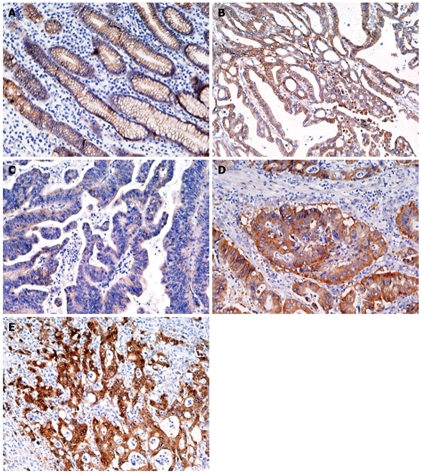
Results: JCV T-Ag protein expression was found in 49% of 90 gastric cancer tissues. T-Ag positivity was not correlated with clinicopathological characteristics. T-Ag expression was detected in a similar percentage of EBV positive cancers (4 of 9, 44%) and EBV negative cancers (35 of 73, 48%). T-Ag expression was detected in a significantly lower percentage of MSI-H cancers (14%) than in non MSI-H cancers (55%, P = 0.005). T-Ag expression was detected in a significantly higher percentage of cancers with nuclear/cytoplasmic localization of beta-catenin (15 of 21, 71%) than in cancers without (42%, P = 0.018). p53 mutations were detected in a significantly lower percentage of T-Ag positive cancers (32%) than in T-Ag negative cancers (57%, P = 0.018). T-Ag positive gastric cancers showed a significant increase in the allelic losses and aberrant methylation compared with T-Ag negative gastric cancers (P = 0.008 and P = 0.003).
Conclusion: The results suggest that JCV T-Ag is involved in gastric carcinogenesis through multiple mechanisms of genetic and epigenetic alterations.
Figures
Similar articles
-
Association of JC virus T-antigen expression with the methylator phenotype in sporadic colorectal cancers.Gastroenterology. 2006 Jun;130(7):1950-61. doi: 10.1053/j.gastro.2006.02.061. Gastroenterology. 2006. PMID: 16762618
-
Gastrointestinal cancers reactive for the PAb416 antibody against JCV/SV40 T-Ag lack JCV DNA sequences while showing a distinctive pathologic profile.J Clin Pathol. 2013 Jan;66(1):44-9. doi: 10.1136/jclinpath-2012-200963. Epub 2012 Sep 25. J Clin Pathol. 2013. PMID: 23012397
-
Oncogenic T-antigen of JC virus is present frequently in human gastric cancers.Cancer. 2006 Aug 1;107(3):481-8. doi: 10.1002/cncr.22028. Cancer. 2006. PMID: 16795066
-
Clinicopathological and molecular alterations in early gastric cancers with the microsatellite instability-high phenotype.Int J Cancer. 2016 Apr 1;138(7):1689-97. doi: 10.1002/ijc.29916. Epub 2015 Dec 17. Int J Cancer. 2016. PMID: 26538087 Free PMC article.
-
Gene methylation in gastric cancer.Clin Chim Acta. 2013 Sep 23;424:53-65. doi: 10.1016/j.cca.2013.05.002. Epub 2013 May 10. Clin Chim Acta. 2013. PMID: 23669186 Review.
Cited by
-
Associations Between Gastric Cancer Risk and Virus Infection Other Than Epstein-Barr Virus: A Systematic Review and Meta-analysis Based on Epidemiological Studies.Clin Transl Gastroenterol. 2020 Jul;11(7):e00201. doi: 10.14309/ctg.0000000000000201. Clin Transl Gastroenterol. 2020. PMID: 32764207 Free PMC article.
-
Immune response to JC virus T antigen in patients with and without colorectal neoplasia.Gut Microbes. 2014 Jul 1;5(4):468-75. doi: 10.4161/gmic.29573. Epub 2014 Jul 9. Gut Microbes. 2014. PMID: 25007286 Free PMC article.
-
Viral Pathogens in Oesophageal and Gastric Cancer.Pathogens. 2022 Apr 15;11(4):476. doi: 10.3390/pathogens11040476. Pathogens. 2022. PMID: 35456151 Free PMC article. Review.
-
No Evidence for an Association between JC Polyomavirus Infection and Gastroduodenal Diseases.Gastrointest Tumors. 2018 Sep;5(1-2):47-53. doi: 10.1159/000489928. Epub 2018 Jul 11. Gastrointest Tumors. 2018. PMID: 30574481 Free PMC article.
-
Study on JV Virus in Patients with Colon Cancer Type Adenocarcinoma.Asian Pac J Cancer Prev. 2019 Apr 29;20(4):1147-1151. doi: 10.31557/APJCP.2019.20.4.1147. Asian Pac J Cancer Prev. 2019. PMID: 31030488 Free PMC article.
References
-
- Ricciardiello L, Laghi L, Ramamirtham P, Chang CL, Chang DK, Randolph AE, Boland CR. JC virus DNA sequences are frequently present in the human upper and lower gastrointestinal tract. Gastroenterology. 2000;119:1228–1235. - PubMed
-
- Enam S, Del Valle L, Lara C, Gan DD, Ortiz-Hidalgo C, Palazzo JP, Khalili K. Association of human polyomavirus JCV with colon cancer: evidence for interaction of viral T-antigen and beta-catenin. Cancer Res. 2002;62:7093–7101. - PubMed
-
- Khalili K, Del Valle L, Otte J, Weaver M, Gordon J. Human neurotropic polyomavirus, JCV, and its role in carcinogenesis. Oncogene. 2003;22:5181–5191. - PubMed
Publication types
MeSH terms
Substances
LinkOut - more resources
Full Text Sources
Medical
Research Materials
Miscellaneous
