

Optimal investment in HIV prevention programs: more is not always better
- PMID: 19938440
- PMCID: PMC2786080
- DOI: 10.1007/s10729-008-9074-7
Optimal investment in HIV prevention programs: more is not always better
Abstract
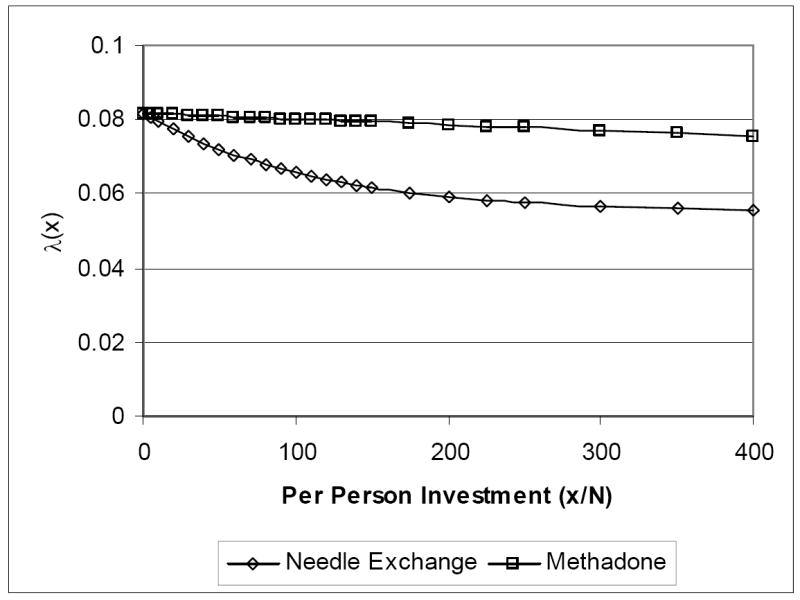
This paper develops a mathematical/economic framework to address the following question: Given a particular population, a specific HIV prevention program, and a fixed amount of funds that could be invested in the program, how much money should be invested? We consider the impact of investment in a prevention program on the HIV sufficient contact rate (defined via production functions that describe the change in the sufficient contact rate as a function of expenditure on a prevention program), and the impact of changes in the sufficient contact rate on the spread of HIV (via an epidemic model). In general, the cost per HIV infection averted is not constant as the level of investment changes, so the fact that some investment in a program is cost effective does not mean that more investment in the program is cost effective. Our framework provides a formal means for determining how the cost per infection averted changes with the level of expenditure. We can use this information as follows: When the program has decreasing marginal cost per infection averted (which occurs, for example, with a growing epidemic and a prevention program with increasing returns to scale), it is optimal either to spend nothing on the program or to spend the entire budget. When the program has increasing marginal cost per infection averted (which occurs, for example, with a shrinking epidemic and a prevention program with decreasing returns to scale), it may be optimal to spend some but not all of the budget. The amount that should be spent depends on both the rate of disease spread and the production function for the prevention program. We illustrate our ideas with two examples: that of a needle exchange program, and that of a methadone maintenance program.
Figures


References
-
- World Health Organization. Global HIV prevalence has levelled off. 2007. [March 7, 2008]. Available at http://www.who.int/mediacentre/news/releases/2007/pr61/en/index.html.
-
- Joint United Nations Programme on HIV/AIDS (UNAIDS) Resource needs for an expanded response to AIDS in low- and middle-income countries. 2005. [March 7, 2008]. Available at http://www.unaids.org/html/pub/publications/irc-pub06/resourceneedsrepor....
-
- Earnshaw SR, Hicks K, Richter A, et al. A linear programming model for allocating HIV prevention funds with state agencies: a pilot study. Health Care Manage Sci. 2007;10(3):239–252. - PubMed
-
- Ruiz M, Gable A, Kaplan EH, et al., editors. No time to lose: getting more from HIV prevention. National Academy Press; Washington, DC: 2001. - PubMed
MeSH terms
Grants and funding
LinkOut - more resources
Full Text Sources
Medical