. 2010 Feb;84(3):1439-52.
doi: 10.1128/JVI.02108-09. Epub 2009 Nov 25.

Tiered categorization of a diverse panel of HIV-1 Env pseudoviruses for assessment of neutralizing antibodies

Affiliations

Tiered categorization of a diverse panel of HIV-1 Env pseudoviruses for assessment of neutralizing antibodies

Michael S Seaman et al. J Virol. 2010 Feb.

Abstract

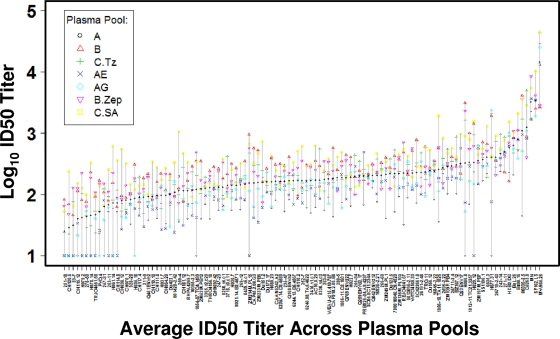
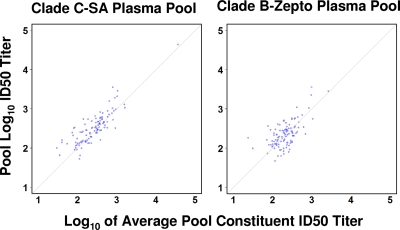
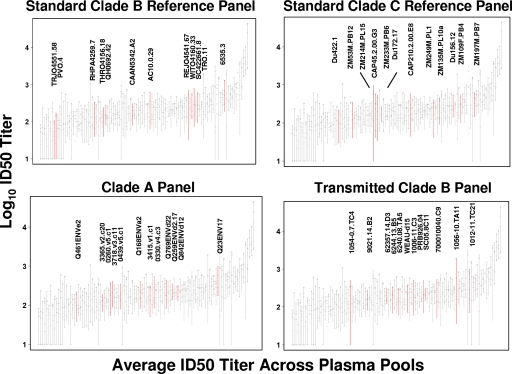
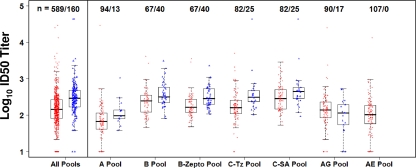
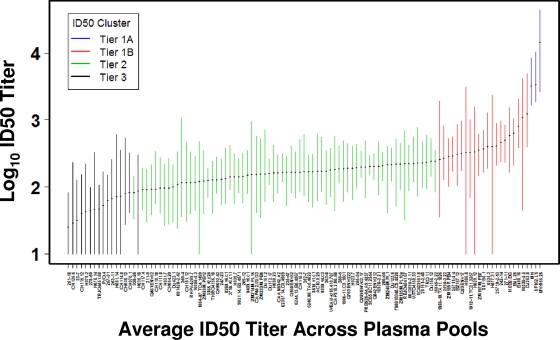
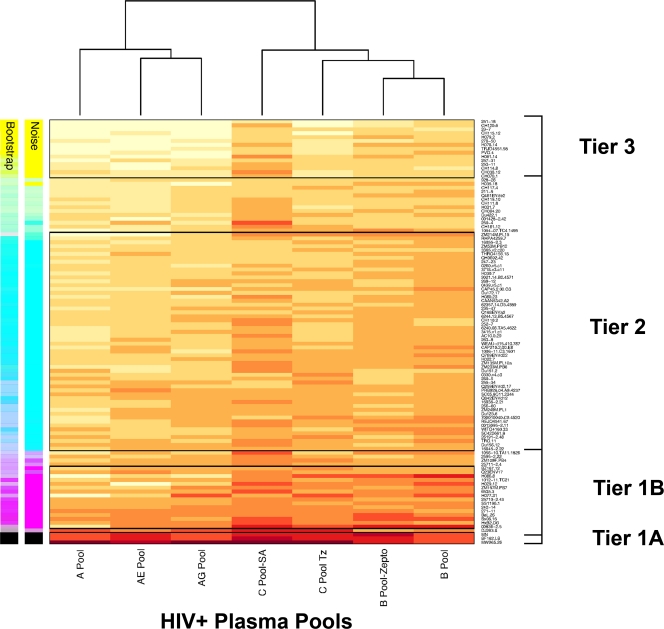
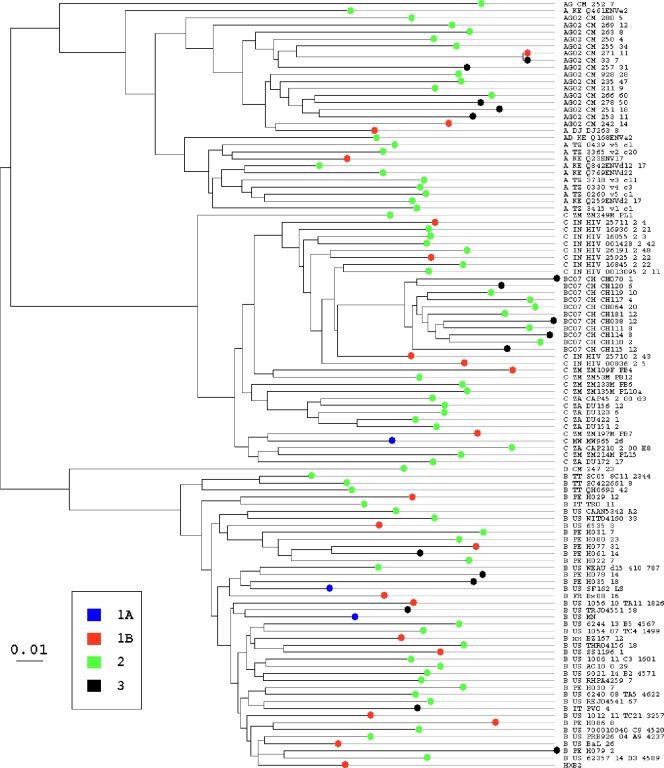
The restricted neutralization breadth of vaccine-elicited antibodies is a major limitation of current human immunodeficiency virus-1 (HIV-1) candidate vaccines. In order to permit the efficient identification of vaccines with enhanced capacity for eliciting cross-reactive neutralizing antibodies (NAbs) and to assess the overall breadth and potency of vaccine-elicited NAb reactivity, we assembled a panel of 109 molecularly cloned HIV-1 Env pseudoviruses representing a broad range of genetic and geographic diversity. Viral isolates from all major circulating genetic subtypes were included, as were viruses derived shortly after transmission and during the early and chronic stages of infection. We assembled a panel of genetically diverse HIV-1-positive (HIV-1(+)) plasma pools to assess the neutralization sensitivities of the entire virus panel. When the viruses were rank ordered according to the average sensitivity to neutralization by the HIV-1(+) plasmas, a continuum of average sensitivity was observed. Clustering analysis of the patterns of sensitivity defined four subgroups of viruses: those having very high (tier 1A), above-average (tier 1B), moderate (tier 2), or low (tier 3) sensitivity to antibody-mediated neutralization. We also investigated potential associations between characteristics of the viral isolates (clade, stage of infection, and source of virus) and sensitivity to NAb. In particular, higher levels of NAb activity were observed when the virus and plasma pool were matched in clade. These data provide the first systematic assessment of the overall neutralization sensitivities of a genetically and geographically diverse panel of circulating HIV-1 strains. These reference viruses can facilitate the systematic characterization of NAb responses elicited by candidate vaccine immunogens.


Figures

FIG. 1.
FIG. 1.
Ordering of HIV-1 isolates based on average neutralization sensitivities. HIV-1 Env pseudoviruses (n = 109) were assessed for neutralization sensitivities using seven pools of subtype-specific HIV-1+ plasma from chronically infected individuals. Viruses are rank ordered from lowest (least sensitive) to highest (most sensitive) on the x axis according to the average log10 ID50 titer from all seven plasma pools. The ID50 titer for each plasma pool is indicated on the y axis by the representative symbol, with the pools having the highest and lowest ID50 titers for each virus connected by a vertical line. The black circles indicate the average ID50 titer across all seven plasma pools. ID50 titers below the limit of detection (1:20) were assigned a value of 10 for this figure.
FIG. 2.
FIG. 2.
Correlation between ID50 titer and pAUC. Neutralization assays performed for all plasma pools and viruses were analyzed to determine the log10 ID50 titer (x axis) and the pAUC (20 to 100% neutralization, y axis). Each symbol represents neutralization data from a single virus-plasma pool pair.
FIG. 3.
FIG. 3.
ID50 titers in plasma pools versus average ID50 titers of constituents. NAb titers against HIV-1 pseudoviruses were assessed using the clade C-SA pool and the clade B-Zepto pool, as well as each of the individual constituents that make up these respective plasma pools. The log10 ID50 titer of each plasma pool (y axis) is plotted against the log10 of the average ID50 titers of the pool constituents (x axis).
FIG. 4.
FIG. 4.
Rank-order distribution within standard virus reference panels. The rank-order distribution of HIV-1 Env pseudoviruses based on average log10 ID50 titers is shown as described for Fig. 1. Individual isolates which constitute the standard clade B reference panel, the standard clade C reference panel, a clade A panel, and a transmitted clade B panel are highlighted in red.
FIG. 5.
FIG. 5.
Higher levels of neutralization activity are observed in the setting of clade match between the virus and plasma sample. For each plasma pool listed, the distribution of log10 ID50 titers of viruses either matched (blue triangles) or mismatched (red circles) in clade is shown. Box plots identify the median and interquartile range of the distribution. Box plots on the far left show data combined across all plasma pools. The number of viruses plotted for each group is indicated as number mismatched/number matched. The two strains of TCLA virus (MN and HxB2) were not included in these analyses to avoid potential bias.
FIG. 6.
FIG. 6.
k-means clustering of HIV-1 Env pseudoviruses. The rank-order distribution of HIV-1 Env pseudoviruses is shown as described for Fig. 1. Results for individual isolates are color coded based on k-means cluster assignments, with the designated tier categories indicated.
FIG. 7.
FIG. 7.
Hierarchical clustering heatmap demonstrating the robustness of designated tier categorization. HIV-1 Env pseudoviruses (n = 109) were assessed for neutralization sensitivities using seven pools of subtype-specific HIV-1+ plasma from chronically infected individuals. Individual viruses are listed on the right side based on neutralization sensitivity rank order, and tier categorization as determined by k-means clustering analysis is indicated. Individual plasma pools are indicated at the bottom of the heatmap, and the dendrogram for plasma clustering is displayed at the top. The magnitude of neutralization (log10 ID50 titers) is denoted by color, in which lower values of neutralization are represented by lighter colors (e.g., light yellows) and higher values are represented by more saturated dark colors (e.g., dark reds). Boxes are drawn around viral isolates in each tier category that grouped with ≥80% probability when uncertainty associated with limited sampling (bootstrap) and assay variability (noise) was incorporated into the k-means clustering analysis. The bootstrap involved resampling the data sets from the plasma pools and reevaluating the k-means clusters 10,000 times and determining how many times each virus was a member of the originally assigned tier classification in the resampled datasets. Env pseudoviruses that clustered with the assigned tier are shown in the column on the left as black for tier 1A, magenta for tier 1B, blue for tier 2, and yellow for tier 3. The probability of falling within a cluster is indicated by the intensity of the color, and the frequency of falling into each of the respective tiers is indicated by the degree of blending of colors (for example, a virus that consistently grouped with tier 1B would be represented by an intense, solid magenta bar in the left column, while a virus associated with tier 3 in 60% of the bootstraps but with tier 2 in the other 40% would be represented as a faint yellow-green band). A limited number of repeat experiments were performed and used to estimate the impact of interassay variability (called noise), and the repeat error was modeled as a log normal distribution of the results. Noise was added back to the actual data based on randomly selecting points from within the model distribution of error, 1,000 noise-added datasets were generated, and k-means clustering was evaluated for each of these. The robustness of the clusters is indicated, in the same manner as the bootstrap, in the second column.
FIG. 8.
FIG. 8.
Phylogenetic tree of Env gp160 sequences. A maximum-likelihood tree indicating the phylogenetic relationships of the Env gp160 sequences from the Env pseudovirus panel is shown. Viruses categorized as tier 1A, 1B, 2, or 3 are color coded as indicated. The scale bar shows the length indicating 1% genetic change.

Similar articles

Cited by

References

    1. Baba, T. W., V. Liska, R. Hofmann-Lehmann, J. Vlasak, W. Xu, S. Ayehunie, L. A. Cavacini, M. R. Posner, H. Katinger, G. Stiegler, B. J. Bernacky, T. A. Rizvi, R. Schmidt, L. R. Hill, M. E. Keeling, Y. Lu, J. E. Wright, T. C. Chou, and R. M. Ruprecht. 2000. Human neutralizing monoclonal antibodies of the IgG1 subtype protect against mucosal simian-human immunodeficiency virus infection. Nat. Med. 6:200-206. - PubMed
    1. Barouch, D. H. 2008. Challenges in the development of an HIV-1 vaccine. Nature 455:613-619. - PMC - PubMed
    1. Bhattacharya, T., M. Daniels, D. Heckerman, B. Foley, N. Frahm, C. Kadie, J. Carlson, K. Yusim, B. McMahon, B. Gaschen, S. Mallal, J. I. Mullins, D. C. Nickle, J. Herbeck, C. Rousseau, G. H. Learn, T. Miura, C. Brander, B. Walker, and B. Korber. 2007. Founder effects in the assessment of HIV polymorphisms and HLA allele associations. Science 315:1583-1586. - PubMed
    1. Binley, J. M., E. A. Lybarger, E. T. Crooks, M. S. Seaman, E. Gray, K. L. Davis, J. M. Decker, D. Wycuff, L. Harris, N. Hawkins, B. Wood, C. Nathe, D. Richman, G. D. Tomaras, F. Bibollet-Ruche, J. E. Robinson, L. Morris, G. M. Shaw, D. C. Montefiori, and J. R. Mascola. 2008. Profiling the specificity of neutralizing antibodies in a large panel of plasmas from patients chronically infected with human immunodeficiency virus type 1 subtypes B and C. J. Virol. 82:11651-11668. - PMC - PubMed
    1. Binley, J. M., T. Wrin, B. Korber, M. B. Zwick, M. Wang, C. Chappey, G. Stiegler, R. Kunert, S. Zolla-Pazner, H. Katinger, C. J. Petropoulos, and D. R. Burton. 2004. Comprehensive cross-clade neutralization analysis of a panel of anti-human immunodeficiency virus type 1 monoclonal antibodies. J. Virol. 78:13232-13252. - PMC - PubMed

Publication types

Substances

LinkOut - more resources