

Detection call algorithms for high-throughput gene expression microarray data
- PMID: 19939941
- PMCID: PMC4110453
- DOI: 10.1093/bib/bbp055
Detection call algorithms for high-throughput gene expression microarray data
Abstract
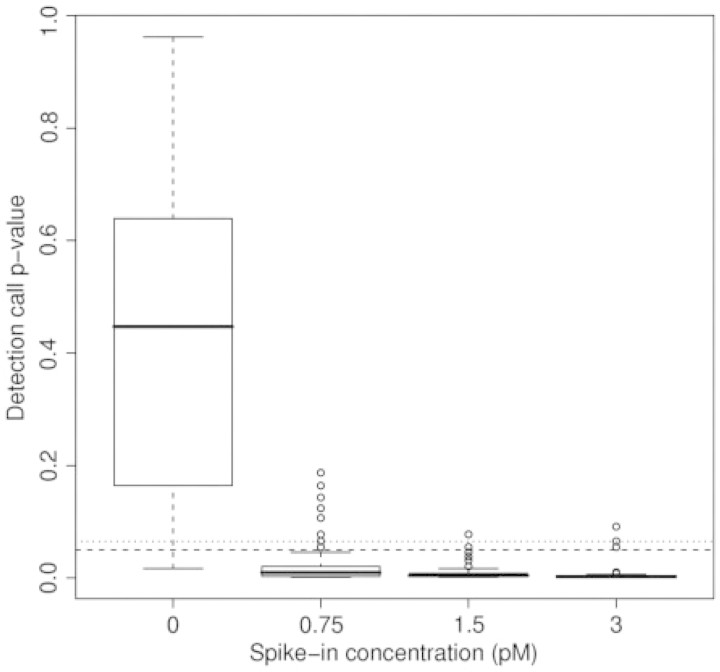
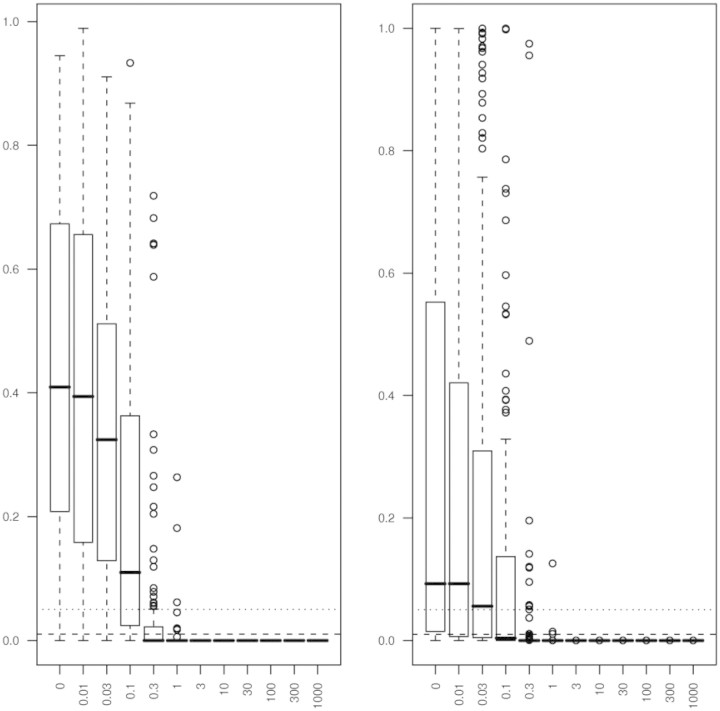
Extensive methodological research has been conducted to improve gene expression summary methods. However, in addition to quantitative gene expression summaries, most platforms, including all those examined in the MicroArray Quality Control project, provide a qualitative detection call result for each gene on the platform. These detection call algorithms are intended to render an assessment of whether or not each transcript is reliably measured. In this paper, we review uses of these qualitative detection call results in the analysis of microarray data. We also review the detection call algorithms for two widely used gene expression microarray platforms, Affymetrix GeneChips and Illumina BeadArrays, and more clearly formalize the mathematical notation for the Illumina BeadArray detection call algorithm. Both algorithms result in a P-value which is then used for determining the qualitative detection calls. We examined the performance of these detection call algorithms and default parameters by applying the methods to two spike-in datasets. We show that the default parameters for qualitative detection calls yield few absent calls for high spike-in concentrations. When genes of interest are expected to be present at very low concentrations, spike-in datasets can be useful for appropriately adjusting the tuning parameters for qualitative detection calls.
Figures
References
-
- Hubbell E, Liu WM, Mei R. Robust estimators for expression analysis. Bioinformatics. 2002;18:1585–1592. - PubMed
-
- Irizarry RA, Hobbs B, Collin F, et al. Exploration, normalization, and summaries of high density oligonucleotide array probe level data. Biostatistics. 2003;4:249–264. - PubMed
-
- Wu Z, Irizarry RA, Gentleman R, et al. A model-based background adjustment for oligonucleotide expression arrays. J Am Stat Assoc. 2004;99:909–917.
Publication types
MeSH terms
Grants and funding
LinkOut - more resources
Full Text Sources
Molecular Biology Databases
Miscellaneous
