. 2010 Feb;103(2):801-16.
doi: 10.1152/jn.00221.2009. Epub 2009 Nov 25.

Role of supplementary eye field in saccade initiation: executive, not direct, control

Affiliations

Role of supplementary eye field in saccade initiation: executive, not direct, control

Veit Stuphorn et al. J Neurophysiol. 2010 Feb.

Abstract

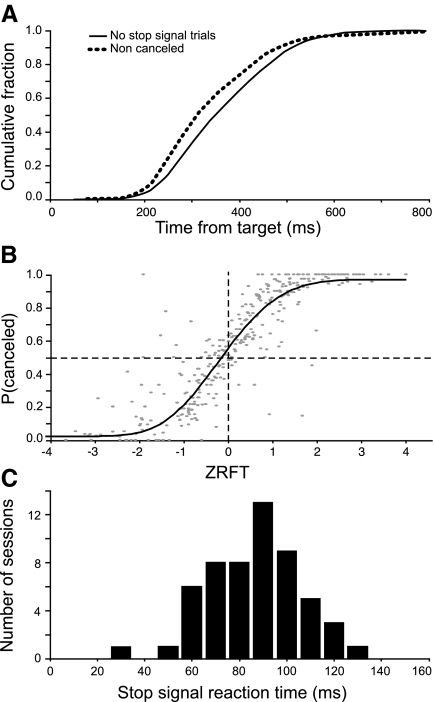
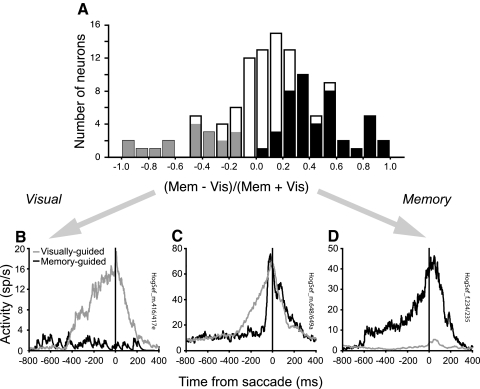
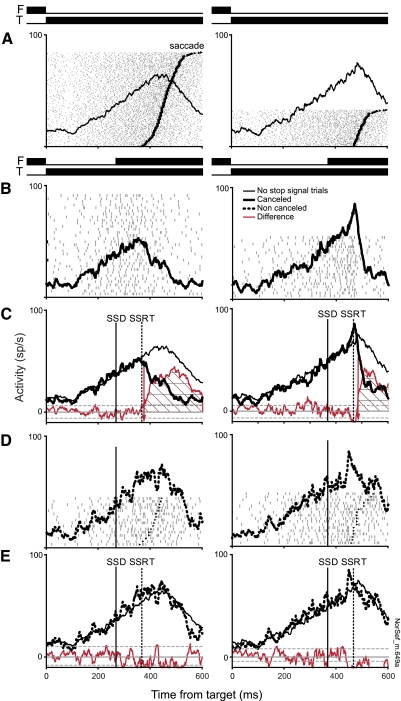
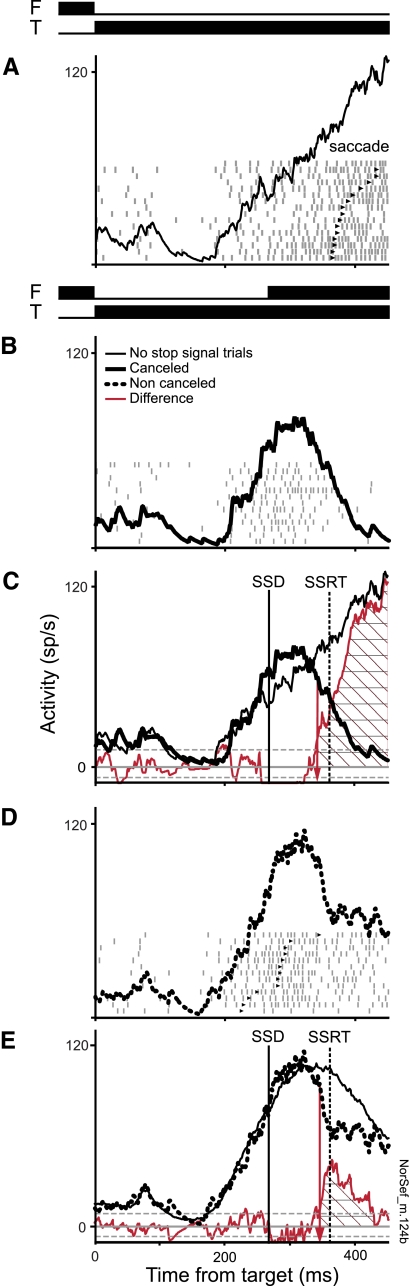
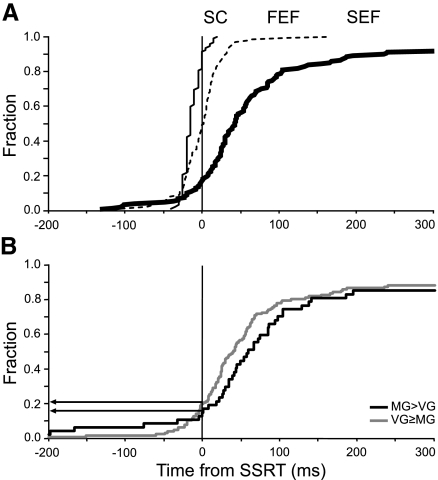
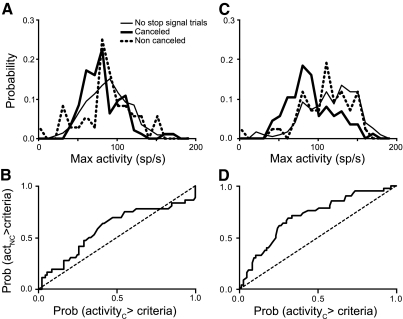
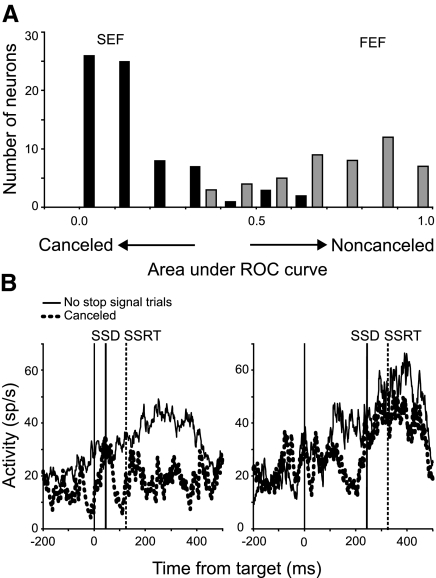
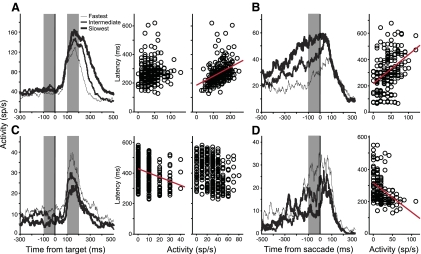
The goal of this study was to determine whether the activity of neurons in the supplementary eye field (SEF) is sufficient to control saccade initiation in macaque monkeys performing a saccade countermanding (stop signal) task. As previously observed, many neurons in the SEF increase the discharge rate before saccade initiation. However, when saccades are canceled in response to a stop signal, effectively no neurons with presaccadic activity display discharge rate modulation early enough to contribute to saccade cancellation. Moreover, SEF neurons do not exhibit a specific threshold discharge rate that could trigger saccade initiation. Yet, we observed more subtle relations between SEF activation and saccade production. The activity of numerous SEF neurons was correlated with response time and varied with sequential adjustments in response latency. Trials in which monkeys canceled or produced a saccade in a stop signal trial were distinguished by a modest difference in discharge rate of these SEF neurons before stop signal or target presentation. These findings indicate that neurons in the SEF, in contrast to counterparts in the frontal eye field and superior colliculus, do not contribute directly and immediately to the initiation of visually guided saccades. However the SEF may proactively regulate saccade production by biasing the balance between gaze-holding and gaze-shifting based on prior performance and anticipated task requirements.


Figures

Fig. 1.
Fig. 1.
Localization of supplementary eye field (SEF). Location of recording sites in monkeys H (A) and A (B) relative to sulcal landmarks based on histology. Location of recording sites in monkeys N (C) and F (D) relative to stereotaxic coordinates, with area indicated from which intracortical microstimulation-evoked saccades with low current thresholds. Patterns of saccades evoked by stimulation at representative sites are shown. Circle size indicates number of neurons with presaccadic activity according to respective scales.
Fig. 2.
Fig. 2.
Saccade countermanding performance. Data are combined across sessions with the 4 monkeys in which the 65 neurons were recorded whose activity in the countermanding task was analyzed for this study. A: cumulative distributions of saccade latencies in the no-stop signal (solid) and noncanceled trials (thick dotted). B: normalized inhibition function from all sessions. Abscissa plots the relative finishing time Z-score (ZRFT) = (mean saccade latency − SSD − SSRT)/SD of saccade latency, where SSD is stop signal delay and SSRT is stop signal reaction time. This quantity is the time relative to the finish times of the GO and STOP processes normalized by the SD of the saccade latencies in trials with a no-stop signal. Each point plots the probability of not canceling the saccade as a function of ZRFT for each session. A Weibull function is fit to the points to highlight the monotonic trend. C: distribution of SSRTs across all sessions for the 4 monkeys.
Fig. 3.
Fig. 3.
Activity associated with visually guided and memory-guided saccades. A: distribution of the contrast between activity in the 50 ms before memory-guided saccades and that before visually guided saccades. Positive values indicate greater activity before memory-guided saccades; negative values indicate greater activation before visually guided saccades. Individually significant differences are filled. Representative neurons that were more active before visually guided (gray) compared with memory-guided (black) saccades (B), equivalently active before memory-guided and visually guided saccades (C), and more active before memory-guided saccades (D).
Fig. 4.
Fig. 4.
Activity of representative SEF neuron with presaccadic activity in the countermanding task. Activity in canceled and noncanceled stop signal trials is compared with activity in latency-matched no-stop signal trials. The rasters and spike density functions are aligned on target onset. The state of the fixation spot (F) and target (T) are indicated above the panels. A: activity during subset of no-stop signal trials with latencies exceeding SSD + SSRT, which are long enough that they would have been canceled if a stop signal had been presented. B: activity during canceled trials with SSDs of 269 ms (left) and 369 ms (right). C: spike density functions of canceled (thick) and latency-matched no signal trials (thin) with their difference (red). The SSD is indicated by solid vertical line; the SSRT is indicated by dotted vertical line. Solid horizontal line indicates the mean difference between the spike density functions in the 600-ms time interval preceding the target onset; dashed horizontal lines mark 2SDs above and below this average. Red arrow marks the first time at which the difference in activity exceeds the criterion difference of 2SDs. Note that the difference in discharge rate arises after SSRT. D: activity during noncanceled trials with SSDs of 269 ms (left) and 369 ms (right). E: spike density functions of noncanceled (thick dotted) and latency-matched no signal trials (thin) with their difference (red). Note the lack of any difference in discharge rate.
Fig. 5.
Fig. 5.
SEF neuron that could contribute to controlling saccade initiation. Note, though, the significant modulation in stop signal trials with noncanceled responses. Conventions as in Fig. 4.
Fig. 6.
Fig. 6.
A: distribution of times of modulation when saccades were canceled relative to stop signal response time for SEF neurons (thick) compared with movement-related neurons sampled in the superior colliculus (SC; thin solid) and frontal eye field (FEF, thin dashed). Unlike movement-related neurons in the SC or the FEF, most SEF neurons modulate well after SSRT and therefore cannot contribute to controlling directly or immediately saccade initiation. A few SEF neurons were modulated very early before SSRT in a proactive manner. SC data from Paré and Hanes (2003); FEF data from Hanes et al. (1998). B: distribution of times of modulation of SEF neurons that were significantly more active before visually guided saccades (black) and those that were significantly less active before visually guided saccades (gray). No difference was observed in the proportion of neurons modulating before SSRT (horizontal arrows).
Fig. 7.
Fig. 7.
Receiver operating characteristic (ROC) curve analysis of activity in canceled and noncanceled trials for the neuron shown in Fig. 4 (A, B) and for the neuron shown in Fig. 5 (C, D). A and C: frequency distributions of peak presaccadic discharge rates during canceled (thick solid) and noncanceled (thick dashed) trials. The values for trials with no stop signal (thin) are plotted for comparison. B and D: ROC derived from the distribution of activity measured during canceled and noncanceled trials (thick line). Chance is indicated by the thin dashed line. The activity of the neuron illustrated in Fig. 4 resulted in ROC area value of 0.59. The activity of the neuron illustrated in Fig. 5 resulted in ROC area of 0.71.
Fig. 8.
Fig. 8.
A: comparison of the distribution of areas under the ROC curves for samples of SEF (black) and FEF (gray) neurons. Values approaching 1.0 indicate greater activity on noncanceled trials when saccades are produced. Values approaching 0.0 indicate greater activity on canceled trials when saccades are inhibited. The values of the SEF were significantly less than the FEF values. B: activity of representative neuron with greater activity on canceled compared with noncanceled trials during trials with shorter (left) and longer (right) SSDs.
Fig. 9.
Fig. 9.
Relationship of saccade response time to SEF activity. The activity of 4 representative neurons is illustrated aligned on target presentation (A, C) and on saccade initiation (B, D). All trials with no stop signal in which the target was presented in the neuron's receptive field were divided into 3 groups according to saccade response time: fastest (thin line), intermediate (middle line), and slowest (thick line). Discharge rate was measured in 3 intervals (indicated by gray background):100 ms before target onset (baseline), 100–200 ms following target onset (target onset), and 100 ms before saccade initiation (movement generation). The saccade response time is plotted against activity on that trial with the linear regressions indicated by the red line if it was significant (P < 0.05). The regression between baseline and target onset activity and saccade response time is shown in A and C, whereas the regression between movement generation activity and saccade response time is shown in B and D. The neuron shown in A and B was more active during saccades with longer response times. The neurons shown in C and D were more active during saccades with shorter response times.
Fig. 10.
Fig. 10.
Distributions of slopes of regressions of saccade latency as a function of discharge rate in the baseline (A), target onset (B), and movement generation (C) intervals. Significant values are filled. The number of significant values and their strength increases the later the time period.
Fig. 11.
Fig. 11.
Outcome probability analysis. Two SEF neurons biasing for (left) and against (right) stopping saccade responses. A and B: activity during memory-guided saccade trials. Note the pronounced visual response and delay period activity with no presaccadic modulation. C and D: superimposed average spike density functions for canceled (solid) and noncanceled (dashed) stop signal trials aligned on target presentation. Activity on canceled trials was truncated after the SSRT and activity on noncanceled trials was truncated after saccade initiation. Dotted vertical lines indicate the earliest (Early) and latest (Late) SSRT based on the variability of SSD. E and F: plot of average (thick) and confidence intervals (thin) of the area under the ROC curve constructed from the distributions of activity on canceled and noncanceled trials as a function of time. Gray background highlights periods during which the area under the ROC was significantly different from a chance value of 0.5. The neuron illustrated on the left exhibited significantly higher discharge rate beginning 300 ms before the target was presented and persisting until about 200 ms after target presentation on noncanceled trials. The neuron illustrated on the right was slightly more active before target presentation and significantly more active before SSRT on canceled trials.
Fig. 12.
Fig. 12.
Distributions of outcome probability values in stop signal trials during the pretarget (A) and the early (B) and the late (C) intervals. Values significantly different from 0.5 are filled. The number of significant values increases in the later time periods.
Fig. 13.
Fig. 13.
Relationship of SEF activity to trial sequence. The activity of 4? (4 cell labels?) representative neurons is illustrated aligned on target presentation (A, C) and on saccade initiation (B, D). All trials with no stop signal in which the target was presented in the neuron's receptive field were divided into 2 groups: those that followed another no-stop signal trial (N-N; thin line) and those that followed a stop signal trial (S-N; thick line). Discharge rate was measured in 3 intervals (indicated by gray background): 100 ms before target onset (baseline), 100–200 ms following target onset (target onset), and 100 ms before saccade initiation (movement generation). Average discharge rate is plotted for N-N and S-N trial sequences; the error bars plot SD and asterisks highlight significant differences.

Similar articles

Cited by

References

    1. Amador N, Schlag-Rey M, Schlag J. Reward-predicting and reward-detecting neuronal activity in the primate supplementary eye field. J Neurophysiol 84: 2166–2170, 2000 - PubMed
    1. Amador N, Schlag-Rey M, Schlag J. Primate antisaccade. II. Supplementary eye field neuronal activity predicts correct performance. J Neurophysiol 91: 1672–1689, 2004 - PubMed
    1. Aron AR, Poldrack RA. Cortical and subcortical contributions to stop signal response inhibition: role of the subthalamic nucleus. J Neurosci 26: 2424–2433, 2006 - PMC - PubMed
    1. Band GP, van der Molen MW, Logan GD. Horse-race model simulations of the stop-signal procedure. Acta Psychol (Amst) 112: 105–142, 2003 - PubMed
    1. Berdyyeva TK, Olson CR. Monkey supplementary eye field neurons signal the ordinal position of both actions and objects. J Neurosci 29: 591–599, 2009 - PMC - PubMed

Publication types