

Rapid EEG desynchronization and EMG activation induced by intravenous cocaine in freely moving rats: a peripheral, nondopamine neural triggering
- PMID: 19939972
- PMCID: PMC2828170
- DOI: 10.1152/ajpregu.00628.2009
Rapid EEG desynchronization and EMG activation induced by intravenous cocaine in freely moving rats: a peripheral, nondopamine neural triggering
Abstract
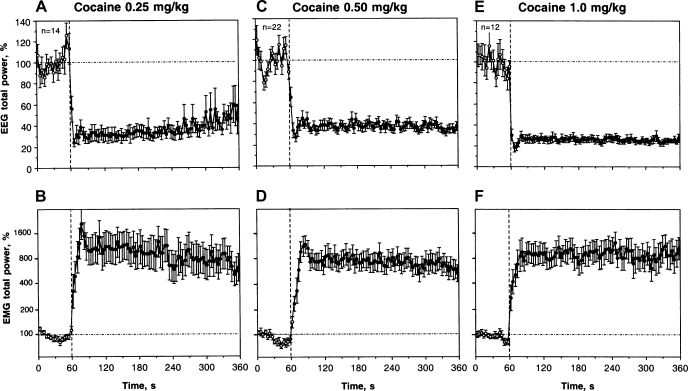
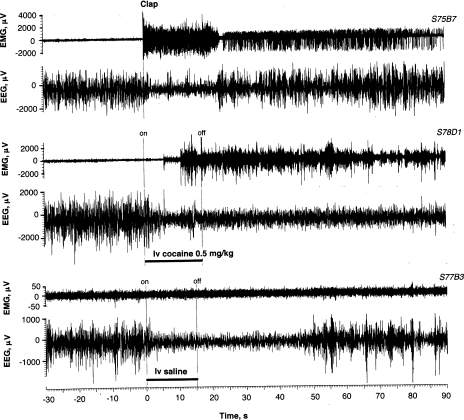
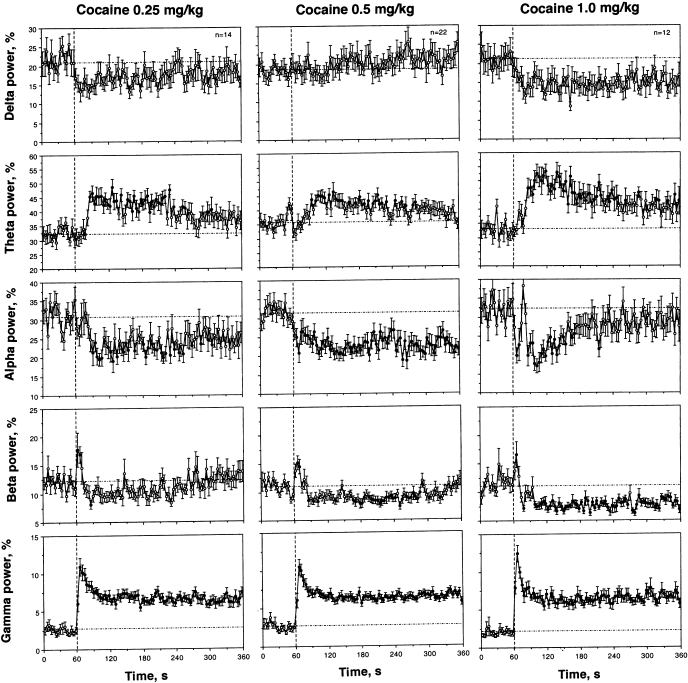
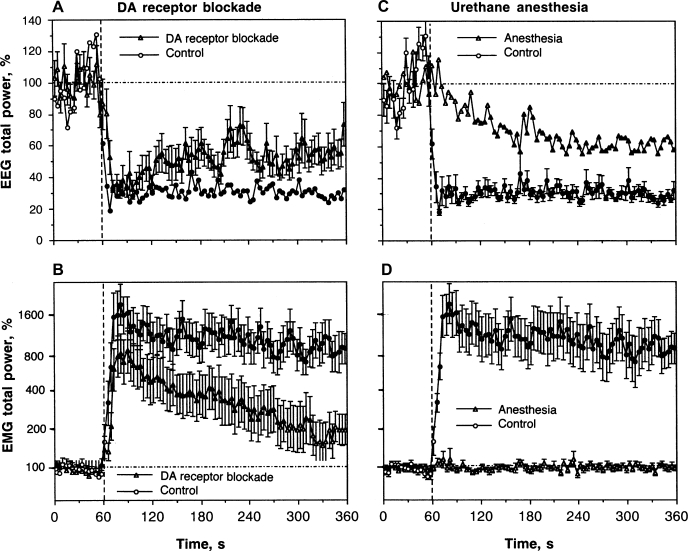
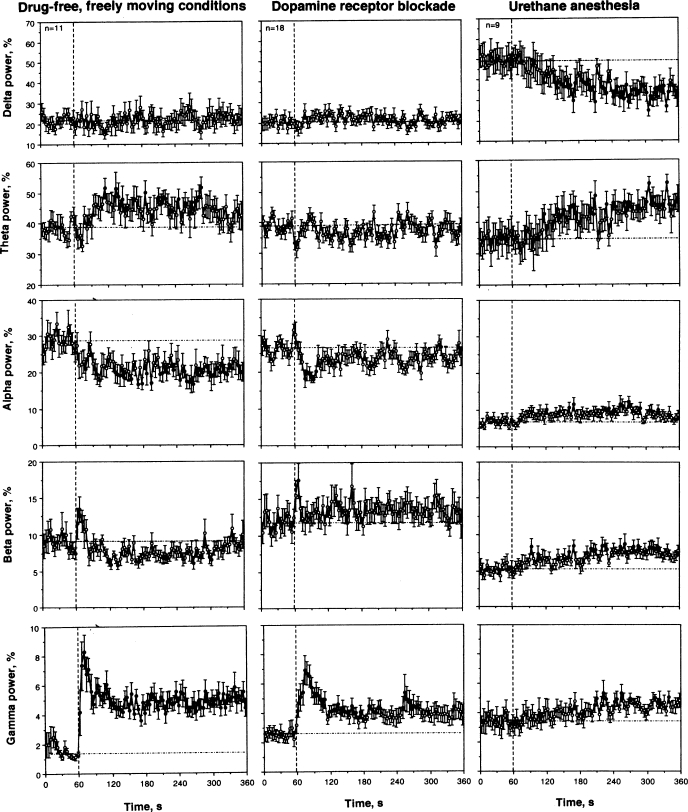
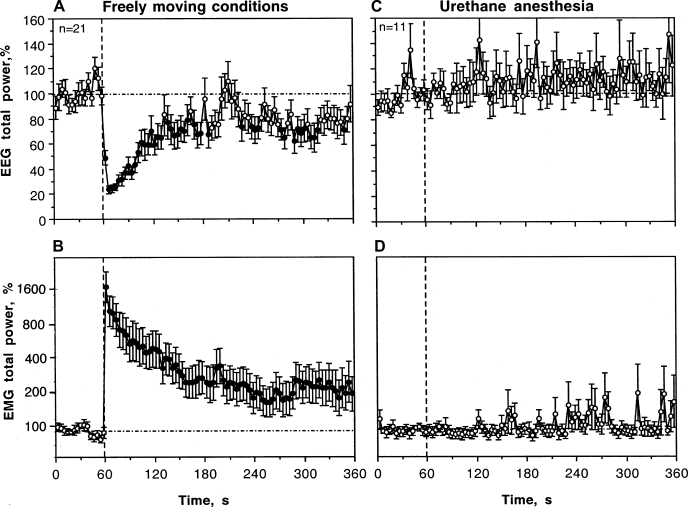
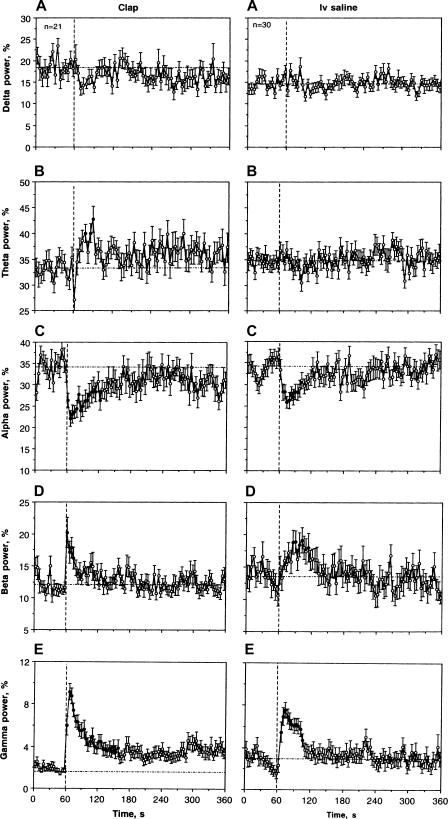
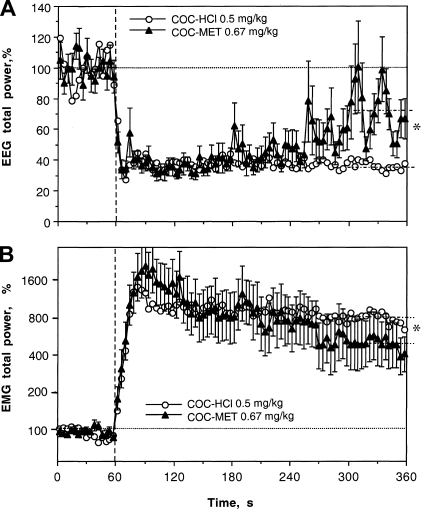
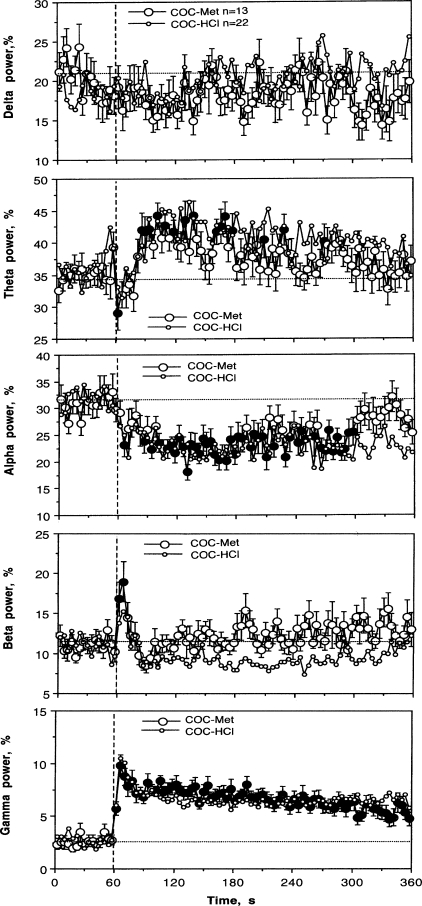
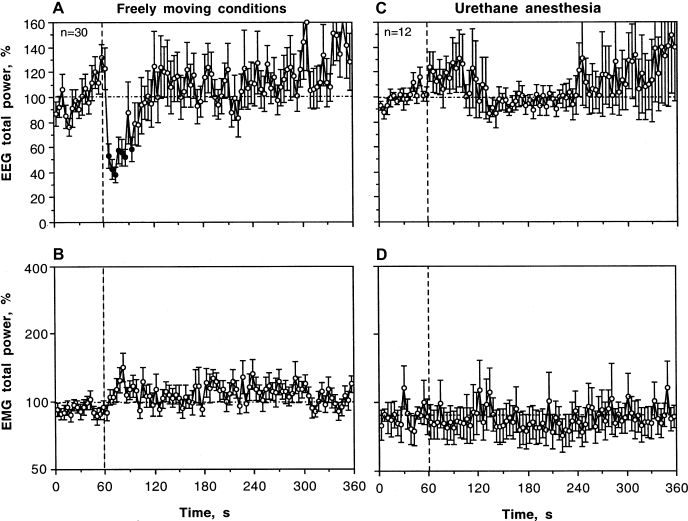
Many important physiological, behavioral, and psychoemotional effects of intravenous (IV) cocaine (COC) are too fast and transient compared with pharmacokinetic predictions, suggesting a possible involvement of peripheral neural mechanisms in their triggering. In the present study, we examined changes in cortical electroencephalogram (EEG) and neck electromyogram (EMG) induced in freely moving rats by IV COC administration at low, reinforcing doses (0.25-1.0 mg/kg) and compared them with those induced by an auditory stimulus and IV COC methiodide, which cannot cross the blood-brain barrier. We found that COC induces rapid, strong, and prolonged EEG desynchronization, associated with decrease in alpha and increase in beta and gamma activities, and EMG activation and that both begin within 2-6 s following the start of a 10-s injection; immediate components of this effect were dose independent. The rapid COC-induced changes in EEG and EMG resembled those induced by an auditory stimulus; the latter effects had shorter onset latencies and durations and were fully blocked during urethane anesthesia. Although urethane anesthesia completely blocked COC-induced EMG activation and rapid components of EEG response, COC still induced EEG desynchronization that was much weaker, greatly delayed (approximately 60 s), and associated with tonic decreases in delta and increases in alpha, beta, and gamma activities. Surprisingly, IV saline delivered during slow-wave sleep (but not quite wakefulness) also induced a transient EEG desynchronization but without changes in EMG activity; these effects were also fully blocked during anesthesia. Peripherally acting COC methiodide fully mimicked rapid EEG and EMG effects of regular COC, but the effects at an equimolar dose were less prolonged than those with regular COC. These data suggest that in awake animals IV COC, like somato-sensory stimuli, induces cortical activation and a subsequent motor response via its action on peripheral neural elements and involving rapid neural transmission. By providing a rapid neural signal and triggering transient neural activation, such an action might play a crucial role in the sensory effects of COC, thus contributing to the learning and development of drug-taking behavior.
Figures
Comment in
-
A central role for the periphery in the rapid action of cocaine on brain neurons: focus on "Rapid EEG desynchronization and EMG activation induced by intravenous cocaine in freely moving rats: a peripheral, nondopamine neural triggering".Am J Physiol Regul Integr Comp Physiol. 2010 Feb;298(2):R283-4. doi: 10.1152/ajpregu.00795.2009. Epub 2009 Dec 9. Am J Physiol Regul Integr Comp Physiol. 2010. PMID: 20007514 No abstract available.
Similar articles
-
Cocaine action on peripheral, non-monoamine neural substrates as a trigger of electroencephalographic desynchronization and electromyographic activation following i.v. administration in freely moving rats.Neuroscience. 2010 Jan 20;165(2):500-14. doi: 10.1016/j.neuroscience.2009.10.037. Neuroscience. 2010. PMID: 19861149 Free PMC article.
-
I.v. cocaine induces rapid, transient excitation of striatal neurons via its action on peripheral neural elements: single-cell, iontophoretic study in awake and anesthetized rats.Neuroscience. 2007 Sep 21;148(4):978-95. doi: 10.1016/j.neuroscience.2007.07.013. Epub 2007 Jul 17. Neuroscience. 2007. PMID: 17706878 Free PMC article.
-
A central role for the periphery in the rapid action of cocaine on brain neurons: focus on "Rapid EEG desynchronization and EMG activation induced by intravenous cocaine in freely moving rats: a peripheral, nondopamine neural triggering".Am J Physiol Regul Integr Comp Physiol. 2010 Feb;298(2):R283-4. doi: 10.1152/ajpregu.00795.2009. Epub 2009 Dec 9. Am J Physiol Regul Integr Comp Physiol. 2010. PMID: 20007514 No abstract available.
-
Critical role of peripheral actions of intravenous nicotine in mediating its central effects.Neuropsychopharmacology. 2011 Sep;36(10):2125-38. doi: 10.1038/npp.2011.104. Epub 2011 Jun 8. Neuropsychopharmacology. 2011. PMID: 21654739 Free PMC article.
-
The Critical Role of Peripheral Targets in Triggering Rapid Neural Effects of Intravenous Cocaine.Neuroscience. 2020 Dec 15;451:240-254. doi: 10.1016/j.neuroscience.2020.09.050. Epub 2020 Oct 1. Neuroscience. 2020. PMID: 33010343 Free PMC article. Review.
Cited by
-
Perineuronal Nets in the Rat Medial Prefrontal Cortex Alter Hippocampal-Prefrontal Oscillations and Reshape Cocaine Self-Administration Memories.J Neurosci. 2024 Aug 21;44(34):e0468242024. doi: 10.1523/JNEUROSCI.0468-24.2024. J Neurosci. 2024. PMID: 38991791 Free PMC article.
-
Rapid Physiological Fluctuations in Nucleus Accumbens Oxygen Levels Induced by Arousing Stimuli: Relationships with Changes in Brain Glucose and Metabolic Neural Activation.Front Integr Neurosci. 2017 Apr 24;11:9. doi: 10.3389/fnint.2017.00009. eCollection 2017. Front Integr Neurosci. 2017. PMID: 28484378 Free PMC article.
-
Arousal-Mediated Sleep Disturbance Persists During Cocaine Abstinence in Male Mice.Front Neurosci. 2022 Jun 23;16:868049. doi: 10.3389/fnins.2022.868049. eCollection 2022. Front Neurosci. 2022. PMID: 35812231 Free PMC article.
-
Central and peripheral contributions to dynamic changes in nucleus accumbens glucose induced by intravenous cocaine.Front Neurosci. 2015 Feb 12;9:42. doi: 10.3389/fnins.2015.00042. eCollection 2015. Front Neurosci. 2015. PMID: 25729349 Free PMC article.
-
Parsing glucose entry into the brain: novel findings obtained with enzyme-based glucose biosensors.ACS Chem Neurosci. 2015 Jan 21;6(1):108-16. doi: 10.1021/cn5002304. Epub 2014 Dec 9. ACS Chem Neurosci. 2015. PMID: 25490002 Free PMC article. Review.
References
-
- Abraham P, Pitner JB, Lewin AH, Boja JW, Kuhar MJ, Carroll FI. N-modified analogues of cocaine: synthesis and inhibition of binding to the cocaine receptor. J Med Chem 35: 141– 144, 1992 - PubMed
-
- Adinoff B, Brady K, Sonne S, Mirabella RF, Kellner CH. Cocaine-like effects of intravenous procaine in cocaine addicts. Addiction Biol 3: 189– 196, 1998 - PubMed
-
- Altschule MD. Emotion and circulation. Circulation 3: 444– 454, 1951 - PubMed
-
- Baker M, Cronin M, Mountjoy D. Variability of skin temperature in the waking monkey. Am J Physiol 230: 449– 455, 1976 - PubMed
Publication types
MeSH terms
Substances
Grants and funding
LinkOut - more resources
Full Text Sources