Review
. 2010 Mar 6;7(44):373-95.
doi: 10.1098/rsif.2009.0443. Epub 2009 Nov 25.

Lipid bilayer regulation of membrane protein function: gramicidin channels as molecular force probes

Affiliations
Review

Lipid bilayer regulation of membrane protein function: gramicidin channels as molecular force probes

Jens A Lundbaek et al. J R Soc Interface. .

Abstract

Membrane protein function is regulated by the host lipid bilayer composition. This regulation may depend on specific chemical interactions between proteins and individual molecules in the bilayer, as well as on non-specific interactions between proteins and the bilayer behaving as a physical entity with collective physical properties (e.g. thickness, intrinsic monolayer curvature or elastic moduli). Studies in physico-chemical model systems have demonstrated that changes in bilayer physical properties can regulate membrane protein function by altering the energetic cost of the bilayer deformation associated with a protein conformational change. This type of regulation is well characterized, and its mechanistic elucidation is an interdisciplinary field bordering on physics, chemistry and biology. Changes in lipid composition that alter bilayer physical properties (including cholesterol, polyunsaturated fatty acids, other lipid metabolites and amphiphiles) regulate a wide range of membrane proteins in a seemingly non-specific manner. The commonality of the changes in protein function suggests an underlying physical mechanism, and recent studies show that at least some of the changes are caused by altered bilayer physical properties. This advance is because of the introduction of new tools for studying lipid bilayer regulation of protein function. The present review provides an introduction to the regulation of membrane protein function by the bilayer physical properties. We further describe the use of gramicidin channels as molecular force probes for studying this mechanism, with a unique ability to discriminate between consequences of changes in monolayer curvature and bilayer elastic moduli.


Figures

Figure 1.
Figure 1.
Conformational changes in membrane proteins. Note the complex structural changes in the bilayer-spanning part of the proteins. (a) KcsA channel in an open and closed conformation. The former structure is based on a truncated form of the channel lacking the C-terminal domain (PDB: 1K4C, Morais-Cabral et al. 2001). For comparison, the latter structure (PDB: 3EFF, Uysal et al. 2009) is shown without this domain. (b) Mechano-sensitive MscS channel in an open and closed conformation (PDB: 2OAU, 2VV5, Bass et al. 2002; Wang et al. 2008). (c) Maltose transporter (MalFGK2) in an inward- and outward-facing state. The former structure is based on a truncated form lacking the TM1 helix (PDB: 3FH6, Khare et al. 2009). For comparison the latter (PDB: 2R6G, Oldham et al. 2007) is shown without the TM1. (d) Sarcoplasmic reticulum Ca2+–ATPase in the Ca2+-loaded E1 and the thapsigargin-stabilized Ca2+-free E2 conformations (PDB: 1SU4, 1IWO, Toyoshima et al. 2000; Toyoshima & Nomura 2002). Figure prepared using Pymol.
Figure 2.
Figure 2.
Hydrophobic coupling between a bilayer-spanning membrane protein (ion channel) and host lipid bilayer. A protein conformational change causes a local bilayer deformation; for simplicity, there is no hydrophobic mismatch in the closed state. Modified from Andersen & Koeppe (2007).
Figure 3.
Figure 3.
Bilayer and monolayer deformations. (a) Bilayer compression and associated energy density; d0 and d denote the thickness of the unperturbed and compressed bilayer, respectively. (Lipid bilayers have much lower volume compressibility than area compressibility (Evans & Hochmuth 1978), and a bilayer thinning is associated with an increase in bilayer area such that the product of thickness and area is approximately constant.) (b) Monolayer bending and associated energy density; c0 is the curvature of the relaxed monolayer, c1 and c2 are the principal curvatures of the deformed monolayer. (c) Lipid molecules with a cylindrical molecular ‘shape’ (indicated by the stippled lines) form monolayers with c0 = 0 (ii). Cone-shaped molecules form non-planar monolayers with, depending on the orientation of the cone section relative to the interface, c0 > 0 (i) or c0 < 0 (iii). In all three cases, two apposed monolayers having similar curvature form planar bilayers (iv).
Figure 4.
Figure 4.
Gramicidin channel formation. (a) Gramicidin channels form by the trans-bilayer dimerization of two subunits, one from each bilayer leaflet. Channel formation is associated with a local bilayer deformation. Modified from Andersen & Koeppe (2007). (b) Side and end views of a bilayer-spanning gramicidin channel, in which the carbon atoms of the two subunits are indicated in yellew and green, respectively. Energy minimized structure representing a composite of structures determined using solid-state and solution NMR (Arseniev et al. 1986; Ketchem et al. 1997; Townsley et al. 2001). We thank Dr Roger E. Koeppe II for the coordinates.
Figure 5.
Figure 5.
Gramicidin single-channel experiments. (a) Experimental setup, with a Teflon chamber separated into two halves by a partition with a hole that allows for contact between the two phases. The bilayer is formed across a hole in the partition. gA is added to the electrolyte solution on both sides of the membrane and adsorbs to the bilayer–solution interface, as illustrated in the expanded view to the right. (b) Effects of lysophosphatidylcholine (LPC) on gA channel behaviour in a diphytanoylphosphatidylcholine (DPhPC)/n-decane bilayer. Current traces recorded from bilayer patches isolated from the same large membrane before (i) and after (ii) addition of 1 µM LPC to the electrolyte solution. (c,d) Current transition amplitude histograms and lifetime distributions for gA channels in the absence or presence of LPC. The lifetime distributions are plotted as survivor curves and fitted by single exponential distributions, N(t)/N(0) = exp{ − t/τ}, where N(t) is the number of channels with lifetimes longer than time t, and τ the average single-channel lifetime. Black line, control; grey line, 1 µM LPC. Modified from Lundbæk & Andersen (1994). 1.0 M NaCl, 200 mV, 25°C.
Figure 6.
Figure 6.
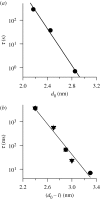
gA channel lifetime (τ) as function of the channel–bilayer hydrophobic mismatch. (a) Relation between τ and hydrophobic thickness (d0) of monoacylglyceride/squalene bilayers. Based on these results, the slope of the ln{τ}–d0 relation is −8.9 nm−1 (r = 0.99), corresponding to HB = 69 kJ mol−1 nm−2. After Lundbæk & Andersen (1999). Lifetime results from Elliott et al. (1983); bilayer hydrophobic thickness determined from bilayer capacitance measurements (Benz et al. 1975). (b) Relation between channel lifetime and channel–bilayer hydrophobic mismatch for phosphatidylcholine/n-decane bilayers. The mismatch was altered using either a sequence-extended 17 amino acid long gA analogue (endo-Gly-D-Ala-gA) in monounsaturated phosphatidylcholine/n-decane bilayers having varying acyl chain length (18, 20 and 22 carbon atoms; filled circles), or using gA channels having varying amino acid sequence length (13, 15 and 17) in dioleoylphosphatidylcholine/n-decane bilayers (filled triangles); bilayer hydrophobic thickness determined from bilayer capacitance measurements (Benz et al. 1975). Based on these results, the slope of the relation between ln{τ} and (d0l) is −7.2 nm−1 (r = 0.98), corresponding to HB = 56 kJ mol−1 nm−2. Experimental results from Hwang et al. (2003).
Figure 7.
Figure 7.
Concentration-dependent effects of Ca2+ on gA channel appearance rate (f; dashed triangle line), lifetime (τ; solid triangle line) and activity (the time-averaged number of conducting channels, n; dashed circle line). By increasing [Ca2+], c0 is changed in the negative direction, and the gA channels are increasingly destabilized. The dashed lines connecting the results for the normalized changes in f and n are meant to guide the eye. Experimental results from Lundbæk et al. (1997).
Figure 8.
Figure 8.
Concentration dependence of the effects of small amphiphiles on gA channel appearance rate (f), lifetime (τ) and activity (n). (a) Results for LPC from Lundbæk & Andersen (1994). Filled triangle, f; filled inverted triangle, τ; filled circle, n. (b) Results for capsaicin from Lundbæk et al. (2005), for DHA from Bruno et al. (2007). Filled triangle: capsaicin, f; filled inverted triangle: capsaicin, τ; filled circle: capsaicin, n; open triangle: DHA, f; open inverted triangle: DHA, τ; open circle: DHA, n.
Figure 9.
Figure 9.
Relation between the amphiphile-induced shifts in VDSC inactivation and gA channel lifetime. The shift in membrane potential for 50 per cent VDSC inactivation (Vin), plotted as VinVin,ref versus the changes in gA channel lifetime (ln{τ/τref}) determined in dioleoylphosphatidylcholine/n-decane bilayers. Black triangle, Triton X-100; red triangle, β-octyl glucoside; green triangle, reduced Triton X-100; blue diamond, Genapol X-100; light blue triangle, capsaicin. For the VDSC experiments, human muscle VDSC, NaV1.4, was expressed in HEK293 cells; the cells were depolarized to +20 mV following 300 ms prepulses to potentials varying from −130 to +50 mV. The gA experiments were done in diphytanoylphosphatidylcholine/n-decane bilayers using 1.0 M NaCl, pH 7 (10 mM HEPES), ±200 mV, 25°C. Experimental results from Lundbæk et al. (2004, 2005).

Similar articles

Cited by

References

    1. Abdul-Manan N., Hinton J. F. 1994. Conformation states of gramicidin A along the pathway to the formation of channels in model membranes determined by 2D NMR and circular dichroism spectroscopy. Biochemistry 33, 6773–6783. (10.1021/bi00188a005) - DOI - PubMed
    1. Adachi S., Nagao T., Ingólfsson H. I., Maxfield F. R., Andersen O. S., Kopelovich L., Weinstein I. B. 2007. The inhibitory effect of (-)-epigallocatechin gallate on activation of the epidermal growth factor receptor is associated with altered lipid order in HT29 colon cancer cells. Cancer Res. 67, 6493–6501. (10.1158/0008-5472.CAN-07-0411) - DOI - PubMed
    1. Alam A., Jiang Y. 2009. High-resolution structure of the open NaK channel. Nature Struct. Mol. Biol. 16, 30–34. (10.1038/nsmb.1531) - DOI - PMC - PubMed
    1. Allen T. W., Andersen O. S., Roux B. 2003. The structure of gramicidin A in a lipid bilayer environment determined using molecular dynamics simulations and solid-state NMR data. J. Am. Chem. Soc. 125, 9868–9878. (10.1021/ja029317k) - DOI - PubMed
    1. Aller S. G., et al. 2009. Structure of P-glycoprotein reveals a molecular basis for poly-specific drug binding. Science 323, 1718–1722. (10.1126/science.1168750) - DOI - PMC - PubMed

Publication types

MeSH terms

LinkOut - more resources