

Fast microtubule dynamics in meiotic spindles measured by single molecule imaging: evidence that the spindle environment does not stabilize microtubules
- PMID: 19940016
- PMCID: PMC2808228
- DOI: 10.1091/mbc.e09-09-0816
Fast microtubule dynamics in meiotic spindles measured by single molecule imaging: evidence that the spindle environment does not stabilize microtubules
Abstract
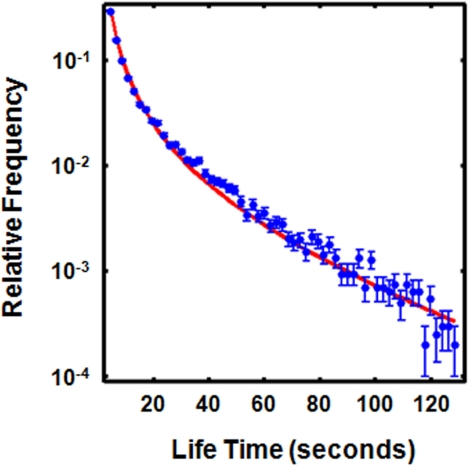
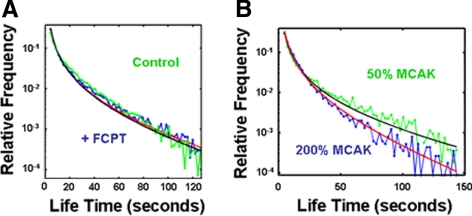
Metaphase spindles are steady-state ensembles of microtubules that turn over rapidly and slide poleward in some systems. Since the discovery of dynamic instability in the mid-1980s, models for spindle morphogenesis have proposed that microtubules are stabilized by the spindle environment. We used single molecule imaging to measure tubulin turnover in spindles, and nonspindle assemblies, in Xenopus laevis egg extracts. We observed many events where tubulin molecules spend only a few seconds in polymer and thus are difficult to reconcile with standard models of polymerization dynamics. Our data can be quantitatively explained by a simple, phenomenological model-with only one adjustable parameter-in which the growing and shrinking of microtubule ends is approximated as a biased random walk. Microtubule turnover kinetics did not vary with position in the spindle and were the same in spindles and nonspindle ensembles nucleated by Tetrahymena pellicles. These results argue that the high density of microtubules in spindles compared with bulk cytoplasm is caused by local enhancement of nucleation and not by local stabilization. It follows that the key to understanding spindle morphogenesis will be to elucidate how nucleation is spatially controlled.
Figures


Similar articles
-
Nucleation and transport organize microtubules in metaphase spindles.Cell. 2012 Apr 27;149(3):554-64. doi: 10.1016/j.cell.2012.03.027. Cell. 2012. PMID: 22541427
-
Regional variation of microtubule flux reveals microtubule organization in the metaphase meiotic spindle.J Cell Biol. 2008 Aug 25;182(4):631-9. doi: 10.1083/jcb.200801105. Epub 2008 Aug 18. J Cell Biol. 2008. PMID: 18710922 Free PMC article.
-
Branching microtubule nucleation in Xenopus egg extracts mediated by augmin and TPX2.Cell. 2013 Feb 14;152(4):768-77. doi: 10.1016/j.cell.2012.12.044. Cell. 2013. PMID: 23415226 Free PMC article.
-
Mechanism and function of poleward flux in Xenopus extract meiotic spindles.Philos Trans R Soc Lond B Biol Sci. 2005 Mar 29;360(1455):623-9. doi: 10.1098/rstb.2004.1616. Philos Trans R Soc Lond B Biol Sci. 2005. PMID: 15897184 Free PMC article. Review.
-
Mechanisms of Mitotic Spindle Assembly.Annu Rev Biochem. 2016 Jun 2;85:659-83. doi: 10.1146/annurev-biochem-060815-014528. Epub 2016 Apr 21. Annu Rev Biochem. 2016. PMID: 27145846 Free PMC article. Review.
Cited by
-
Chemical tools for dissecting cell division.Nat Chem Biol. 2021 Jun;17(6):632-640. doi: 10.1038/s41589-021-00798-3. Epub 2021 May 25. Nat Chem Biol. 2021. PMID: 34035515 Free PMC article. Review.
-
Toward the cellular-scale simulation of motor-driven cytoskeletal assemblies.Elife. 2022 May 26;11:e74160. doi: 10.7554/eLife.74160. Elife. 2022. PMID: 35617115 Free PMC article.
-
Physical basis of spindle self-organization.Proc Natl Acad Sci U S A. 2014 Dec 30;111(52):18496-500. doi: 10.1073/pnas.1409404111. Epub 2014 Dec 2. Proc Natl Acad Sci U S A. 2014. PMID: 25468965 Free PMC article.
-
Interactive, computer-assisted tracking of speckle trajectories in fluorescence microscopy: application to actin polymerization and membrane fusion.Biophys J. 2011 Oct 5;101(7):1794-804. doi: 10.1016/j.bpj.2011.09.007. Biophys J. 2011. PMID: 21961607 Free PMC article.
-
Microtubule reorganization during female meiosis in C. elegans.Elife. 2021 Jun 11;10:e58903. doi: 10.7554/eLife.58903. Elife. 2021. PMID: 34114562 Free PMC article.
References
-
- Athale C. A., Dinarina A., Mora-Coral M., Pugieux C., Nedelec F., Karsenti E. Regulation of microtubule dynamics by reaction cascades around chromosomes. Science. 2008;322:1243–1247. - PubMed
-
- Belmont L. D., Hyman A. A., Sawin K. E., Mitchison T. J. Real-time visualization of cell cycle-dependent changes in microtubule dynamics in cytoplasmic extracts. Cell. 1990;62:579–589. - PubMed
Publication types
MeSH terms
Substances
Grants and funding
LinkOut - more resources
Full Text Sources
Other Literature Sources
