. 2010 Feb 1;21(3):456-69.
doi: 10.1091/mbc.e09-05-0420. Epub 2009 Nov 25.

Dissection of combinatorial control by the Met4 transcriptional complex

Affiliations

Dissection of combinatorial control by the Met4 transcriptional complex

Traci A Lee et al. Mol Biol Cell. .

Abstract

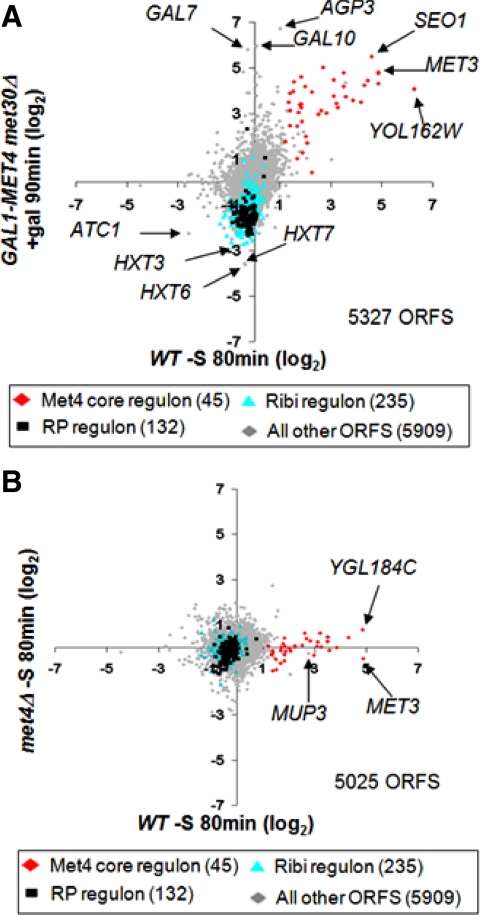
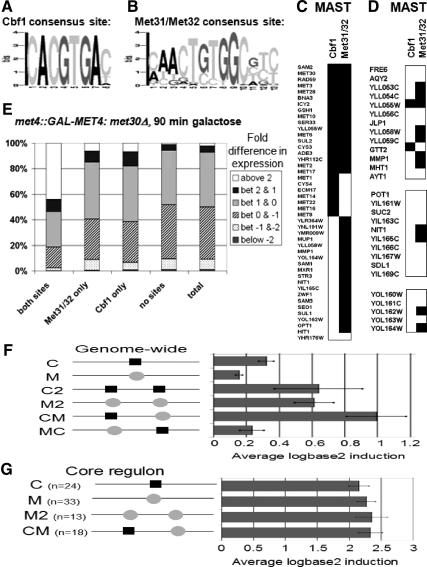
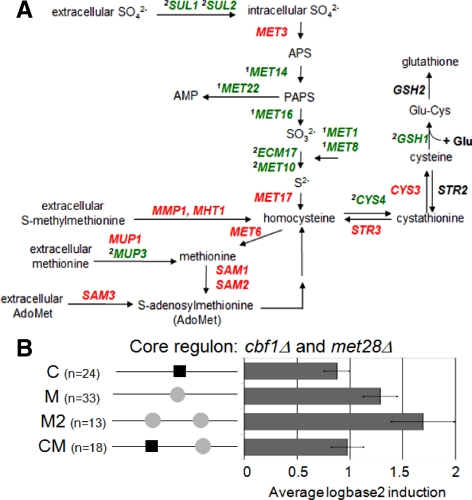
Met4 is the transcriptional activator of the sulfur metabolic network in Saccharomyces cerevisiae. Lacking DNA-binding ability, Met4 must interact with proteins called Met4 cofactors to target promoters for transcription. Two types of DNA-binding cofactors (Cbf1 and Met31/Met32) recruit Met4 to promoters and one cofactor (Met28) stabilizes the DNA-bound Met4 complexes. To dissect this combinatorial system, we systematically deleted each category of cofactor(s) and analyzed Met4-activated transcription on a genome-wide scale. We defined a core regulon for Met4, consisting of 45 target genes. Deletion of both Met31 and Met32 eliminated activation of the core regulon, whereas loss of Met28 or Cbf1 interfered with only a subset of targets that map to distinct sectors of the sulfur metabolic network. These transcriptional dependencies roughly correlated with the presence of Cbf1 promoter motifs. Quantitative analysis of in vivo promoter binding properties indicated varying levels of cooperativity and interdependency exists between members of this combinatorial system. Cbf1 was the only cofactor to remain fully bound to target promoters under all conditions, whereas other factors exhibited different degrees of regulated binding in a promoter-specific fashion. Taken together, Met4 cofactors use a variety of mechanisms to allow differential transcription of target genes in response to various cues.


Figures

Figure 1.
Figure 1.
Functional gene clusters affected by Met4 hyperactivation. (A) Scatter plot comparing microarray profiles of wild-type and met4::GAL1-MET4 cells after 90 min of galactose induction in rich media. Expression data are represented on a log2 scale. The number of ORFs compared is indicated at bottom right. (B) Microarray profiles of met4::GAL1-MET4 met30Δ cells harvested at 15, 30, 60, and 90 min after galactose induction compared with cells harvested before galactose induction. Inductions and repressions greater than twofold are marked by red and green boxes, respectively. Less than twofold changes in transcription are represented by black boxes, and unreliable measurements are marked by gray boxes. Note: Partial MET30 transcripts are detected because the met30Δ strain was constructed by an internal disruption of the gene (Thomas et al., 1995). (C) Scatter plot comparing microarray profiles of met4::GAL1-MET4 and met4::GAL1-MET4 met30Δ cells after 90 min of galactose induction in rich media. (D) Schematic of three chromosomal clusters induced in the met4::GAL1-MET4 met30Δ strain. Red arrows, at least a twofold induction; green arrows, at least a twofold repression; black arrows, no significant change.
Figure 2.
Figure 2.
Comparison of microarray profiles. (A) Scatter plot comparing microarray profiles of wild-type cells at 80 min after methionine removal in minimal media and met4::GAL1-MET4 met30Δ cells at 90 min after galactose induction in rich media. (B) Scatter plot comparing microarray profiles of wild-type and met4Δ cells at 80 min after methionine removal in minimal media.
Figure 3.
Figure 3.
Analysis of Cbf1 and Met31/Met32 binding motifs. MEME PSSMs for (A) Cbf1 and (B) Met31/Met32 binding motifs (determined from regions −500 to −1 relative to each ORF). MAST identification of Cbf1 and Met31/Met32 binding sites (within regions −950 to +50 relative to each ORF) for (C) the Met4 core regulon and (D) the GAL1-MET4 chromosomal clusters. Genes with MAST matches above an E-value of 500 are marked by black boxes. (E) Correlation between transcriptional induction upon Met4 hyperactivation (as determined by microarray) and promoter presence of Met31/Met32 and Cbf1 sites (as determined by MAST). (F) Averaged log2 induction levels upon both Met4 hyperactivation and sulfur limitation for six previously identified sets of genes based on promoter composition (Chiang et al., 2006). C and M sites represent exact matches to Cbf1 (TCACGTG) and Met31/32 (TGTGGC) motifs, respectively. (G) Averaged log2 inductions for core regulon targets categorized in four of six promoter categories upon both Met4 hyperactivation and sulfur limitation.
Figure 4.
Figure 4.
Microarray profiles of Met4 core regulon transcripts in wild-type and cofactor deletion strains upon Met4 hyperactivation and sulfur starvation. Inductions and repressions greater than twofold are marked by red and green boxes, respectively. Black boxes, less than twofold changes in transcription; gray boxes, unreliable measurements. Core regulon genes are clustered into three classes (far left) based on Cbf1/Met28-dependency. Columns a–f were harvested at 15, 30, 60, and 90 min after a shift from raffinose to galactose in rich media. Columns g–k were harvested at 20, 40, and 80 min after removal of methionine from minimal media. Microarray profiles represent fold-change over transcript levels found before galactose shift or methionine removal. Microarray profiles for two independent time courses are shown for the methionine-removal studies. Rightmost column uses black boxes to represent promoters with matches to Met31/Met32 and Cbf1 motifs as determined by MAST.
Figure 5.
Figure 5.
(A) Schematic of the sulfur assimilation pathway (adapted from Thomas and Surdin-Kerjan, 1997). Cbf1-dependent class 1 and class 2 genes are green, with the class number listed as a superscript, and Cbf1-independent class 3 genes are red. Nontarget genes are black. (B) Averaged log2 inductions for core regulon targets categorized in four of six promoter categories upon both Met4 hyperactivation and sulfur limitation in cells with a cbf1Δ or met28Δ background.
Figure 6.
Figure 6.
Loss of both Met31 and Met32 blocks the Met4 transcriptional response and partially rescues met4::GAL1-MET4 met30Δ lethality. (A) Different strains with met4::GAL1-MET4 background were streaked onto rich-media plates containing glucose or galactose. (B) Scatter plot comparing microarray profiles of met4::GAL1-MET4 met30Δ cells with met4::GAL1-MET4 met30Δmet31Δmet32Δ cells after 90 min of galactose treatment in rich media. (C) Scatter plot comparing microarray profiles of met4::GAL1-MET4 cells with met4::GAL1-MET4 met30Δmet31Δmet32Δ cells after 90 min of galactose treatment in rich media.
Figure 7.
Figure 7.
(A) Western analysis of epitope-tagged Met4, Cbf1, Met28, Met31, Met32, TFIIB, and Rpb3 in minimal media at 1 h after methionine removal (−) and at 40 min after subsequent addition of methionine (+). (B) Western analysis of untagged Met4, Cbf1, Met28, Met32, and Rpb3 using same growth conditions. Asterisk (*) indicates a nonspecific cross-reactive protein. (C) ChIP promoter binding properties for Rpb1 at 1 h after methionine removal in wild-type and various deletion strains. Promoter binding is represented on a yellow-blue color scale relative to the highest captured promoter detected for Rpb1, which is set at 100. The MAST panel uses black boxes to identify promoters that were detected by MAST to contain Cbf1 and/or Met31/Met32 motifs. Column labeled class indicates category of Cbf1/Met28 dependency (see text).
Figure 8.
Figure 8.
(A) ChIP promoter binding properties for Met4, Met28, Met31, Met32, Cbf1, TFIIB, Rpb3, and Rpb1. A color scale (right column) shows promoter binding relative to the highest percent capture detected for each immunoprecipitated factor (Met4HA, Met4, Met28, Met28Myc, Met31Myc, Met32, Met32Myc, Cbf1, Cbf1HA, TFIIBMyc, Rpb3HA, and Rpb1), which is arbitrarily set at 100. TFIIBMyc binding is the average of TFIIBMyc binding values from HAMet4/TFIIBMyc and Cbf1HA/TFIIBMyc ChIP, and Rpb3HA binding is the average of Rpb3HA binding values from Met28Myc/Rpb3HA, Met31Myc/Rpb3HA, and Met32Myc/Rpb3HA ChIP. The MAST panel uses black boxes to identify promoters that were detected by MAST to contain Cbf1 and/or Met31/Met32 motifs. Column labeled class indicates category of Cbf1/Met28 dependency. (B) ChIP of Met31Myc/Rpb3HA and Met32Myc/Rpb3HA cells. Percent capture is represented as the percentage of the total promoter available. Samples were harvested at 1 h after methionine removal from B-media (0 met, second bar grouping) and at 40 min after subsequent treatment with 1 mM methionine (1 mM met, third bar grouping). Background percent capture levels were determined in untagged wild-type cells upon methionine starvation (first bar grouping).
Figure 9.
Figure 9.
(A) Western analysis of untagged Met4, Cbf1, Met28, Met32, and Rpb3 from wild-type and deletion strains grown in minimal media at 1 h after methionine removal. Asterisk (*) indicates a nonspecific cross-reactive protein. (B) ChIP promoter binding properties for Met4, Met28, Met32, and Cbf1 in minimal media at 1 h after methionine removal for wild-type and deletion strains. Promoter binding is represented on a yellow-blue color scale relative to the highest percent capture detected for each antibody, which was arbitrarily set at 100. The MAST panel uses black boxes to identify promoters that were detected by MAST to contain Cbf1 and/or Met/Met32 motifs. Column labeled class indicates category of Cbf1/Met28 dependency.
Figure 10.
Figure 10.
Model for target gene activation by Met4 and its cofactors based on promoter composition, promoter binding behavior, and gene expression data. Met4 activity is inhibited by the SCFMet30 ubiquitin ligase, which targets Met4 for ubiquitylation. Poly-ubiquitylated Met4 is degraded while oligo-ubiquitylated Met4 is inactive. Deubiquitylation by an uncharacterized ubiquitin protease (Ubp) and phosphorylation by an uncharacterized kinase convert Met4 to its active form. Activated Met4 interacts with Met31, Met32, Met28, and Cbf1 at promoters to recruit RNA polymerase II (RNAPII) and the general transcriptional machinery to Met4 target genes. See text for details.

Similar articles

Cited by

References

    1. Ahmed Khan S., Zhang N., Ismail T., El-Moghazy A. N., Butt A., Wu J., Merlotti C., Hayes A., Gardner D. C., Oliver S. G. Functional analysis of eight open reading frames on chromosomes XII and XIV of Saccharomyces cerevisiae. Yeast. 2000;16:1457–1468. - PubMed
    1. Aranda A., del Olmo M. L. Exposure of Saccharomyces cerevisiae to acetaldehyde induces sulfur amino acid metabolism and polyamine transporter genes, which depend on Met4p and Haa1p transcription factors, respectively. Appl. Environ. Microbiol. 2004;70:1913–1922. - PMC - PubMed
    1. Ausubel F., Brent R., Kingston R. E., Moore D. D., Seidman J. G., Smith J. A., Struhl K., editors. Short Protocols in Molecular Biology. 3rd Ed. New York: John Wiley & Sons; 1995.
    1. Bailey T. L., Elkan C. Fitting a mixture model by expectation maximization to discover motifs in biopolymers. Proceedings of the Second International Conference on Intelligent Systems for Molecular Biology; Menlo Park, CA: AAAI Press; 1994. pp. 28–36. - PubMed
    1. Bailey T. L., Gribskov M. Combining evidence using p-values: application to sequence homology searches. Bioinformatics. 1998;14:48–54. - PubMed

Publication types

MeSH terms

Substances

LinkOut - more resources