

Forecasting distribution of body mass index in the United States: is there more room for growth?
- PMID: 19940085
- PMCID: PMC4575807
- DOI: 10.1177/0272989X09351749
Forecasting distribution of body mass index in the United States: is there more room for growth?
Abstract
Background: Much of the literature on obesity has consistently documented the unprecedented rise in body weight over the past 2 decades. Less attention is paid to future projections of the population distribution of body mass index (BMI).
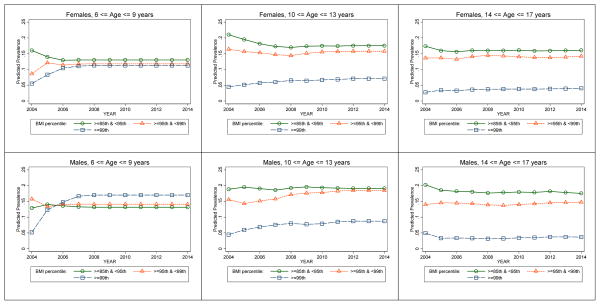
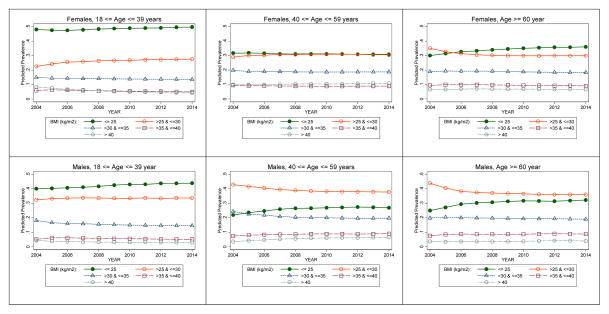
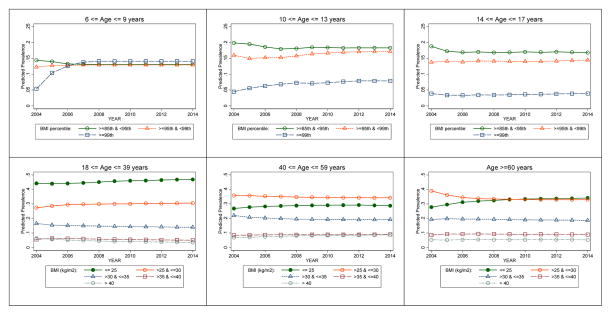
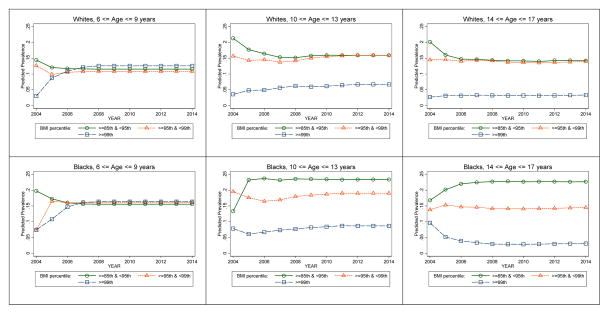
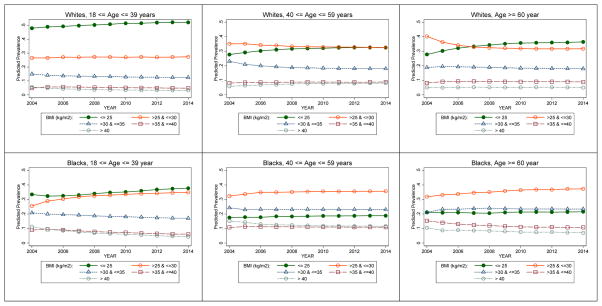
Objective: To forecast the distribution of BMI in children (6-17 years) and adults (>17 years) in the United States (US) by age group, sex, and race over the period 2004-2014.
Methods: Analysis of Medical Expenditure Panel Survey data (2001-2002 and 2004- 2005) to estimate and compare the 1-year transitions across BMI categories for children and adults. Forecasting distributions of obesity over 2004-2014 using a probabilistic population-level simulation model and validating it with prevalence data from 2005-2006 National Health and Nutrition Examination Survey.
Results: During 2004- 2005, a majority of adults in each BMI category remained in the same category after 1 year, these estimates being not significantly different than the corresponding estimates in 2001-2002. Among children, stabilities within BMI categories are low during 2004-2005, and compared with 2001-2002, transition probabilities into overweight class 2 from other BMI categories increase substantially. Forecasts reveal significant increases in the risk of overweight category among children 6 to 9 years old (5% to 14% in 5 years), with a greater increase anticipated in males, and increases in the overweight category for many years to come for adults, although the adult obesity prevalence remains at the current levels.
Conclusions: Although the absolute levels of obesity remain high among US adults, the growth in obesity appears to have stagnated. On the contrary, continued growth in the prevalence of the highest BMI category for children is anticipated.
Figures
References
-
- Portier K, Tolson JK, Roberts SM. Body weight distributions for risk assessment. Risk Analysis. 2007;27(1):11–26. - PubMed
-
- Flegal KM, Troiano RP. Changes in the distribution of body mass index of adults and children in the US population. Int J Obes Relat Metab Disord. 2000;24:807–18. - PubMed
-
- G, Reaven M. Role of insulin resistance in human disease. Diabetes. 1988;37:1595–1607. - PubMed
-
- Murdolo G, Smith U. The dysregulated adipose tissue: A connecting link between insulin resistance, type 2 diabetes mellitus and atherosclerosis. Nutrition, Metabolism and Cardiovascular Diseases. 2006;16(1):S35–S38. - PubMed
-
- Flegal KM, Carroll MD, Kuczmarski RJ, Johnson CL. Overweight and obesity in the United States: prevalence and trends, 1960–1994. Int J Obes Relat Metab Disord. 1998;22:39–47. - PubMed
Publication types
MeSH terms
Grants and funding
LinkOut - more resources
Full Text Sources
Medical
Miscellaneous
