

Effect of episodic hypoxia on the susceptibility to hypocapnic central apnea during NREM sleep
- PMID: 19940101
- PMCID: PMC2822673
- DOI: 10.1152/japplphysiol.00308.2009
Effect of episodic hypoxia on the susceptibility to hypocapnic central apnea during NREM sleep
Abstract
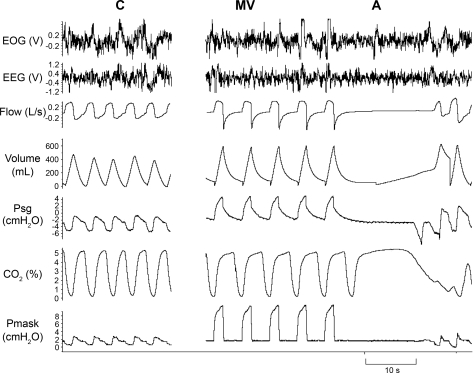
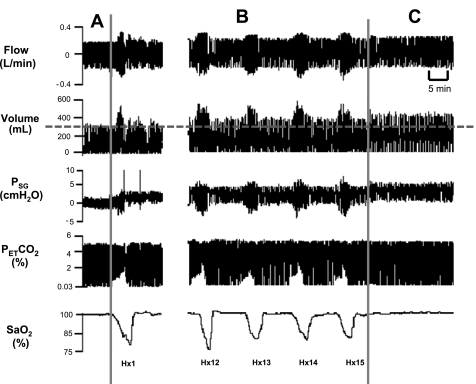
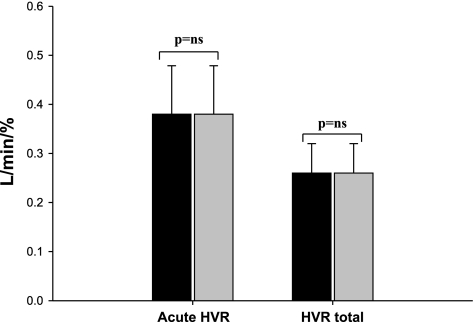
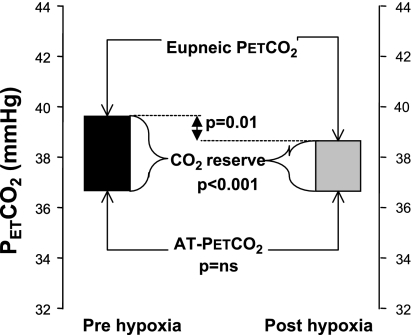
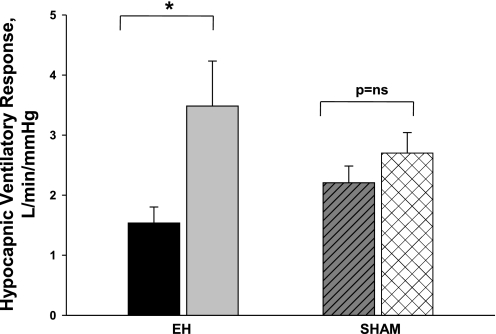
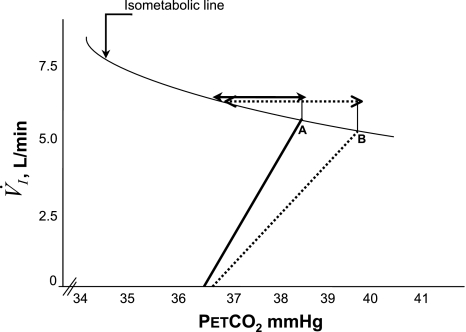
We hypothesized that episodic hypoxia (EH) leads to alterations in chemoreflex characteristics that might promote the development of central apnea in sleeping humans. We used nasal noninvasive positive pressure mechanical ventilation to induce hypocapnic central apnea in 11 healthy participants during stable nonrapid eye movement sleep before and after an exposure to EH, which consisted of fifteen 1-min episodes of isocapnic hypoxia (mean O(2) saturation/episode: 87.0 +/- 0.5%). The apneic threshold (AT) was defined as the absolute measured end-tidal PCO(2) (Pet(CO(2))) demarcating the central apnea. The difference between the AT and baseline Pet(CO(2)) measured immediately before the onset of mechanical ventilation was defined as the CO(2) reserve. The change in minute ventilation (V(I)) for a change in Pet(CO(2)) (DeltaV(I)/ DeltaPet(CO(2))) was defined as the hypocapnic ventilatory response. We studied the eupneic Pet(CO(2)), AT Pet(CO(2)), CO(2) reserve, and hypocapnic ventilatory response before and after the exposure to EH. We also measured the hypoxic ventilatory response, defined as the change in V(I) for a corresponding change in arterial O(2) saturation (DeltaV(I)/DeltaSa(O(2))) during the EH trials. V(I) increased from 6.2 +/- 0.4 l/min during the pre-EH control to 7.9 +/- 0.5 l/min during EH and remained elevated at 6.7 +/- 0.4 l/min the during post-EH recovery period (P < 0.05), indicative of long-term facilitation. The AT was unchanged after EH, but the CO(2) reserve declined significantly from -3.1 +/- 0.5 mmHg pre-EH to -2.3 +/- 0.4 mmHg post-EH (P < 0.001). In the post-EH recovery period, DeltaV(I)/DeltaPet(CO(2)) was higher compared with the baseline (3.3 +/- 0.6 vs. 1.8 +/- 0.3 l x min(-1) x mmHg(-1), P < 0.001), indicative of an increased hypocapnic ventilatory response. However, there was no significant change in the hypoxic ventilatory response (DeltaV(I)/DeltaSa(O(2))) during the EH period itself. In conclusion, despite the presence of ventilatory long-term facilitation, the increase in the hypocapnic ventilatory response after the exposure to EH induced a significant decrease in the CO(2) reserve. This form of respiratory plasticity may destabilize breathing and promote central apneas.
Figures
Similar articles
-
Sustained hyperoxia stabilizes breathing in healthy individuals during NREM sleep.J Appl Physiol (1985). 2010 Nov;109(5):1378-83. doi: 10.1152/japplphysiol.00453.2010. Epub 2010 Aug 19. J Appl Physiol (1985). 2010. PMID: 20724559 Free PMC article. Clinical Trial.
-
Aging is associated with increased propensity for central apnea during NREM sleep.J Appl Physiol (1985). 2018 Jan 1;124(1):83-90. doi: 10.1152/japplphysiol.00125.2017. Epub 2017 Oct 12. J Appl Physiol (1985). 2018. PMID: 29025898 Free PMC article.
-
Increased propensity for central apnea in patients with obstructive sleep apnea: effect of nasal continuous positive airway pressure.Am J Respir Crit Care Med. 2010 Jan 15;181(2):189-93. doi: 10.1164/rccm.200810-1658OC. Epub 2009 Sep 17. Am J Respir Crit Care Med. 2010. PMID: 19762565 Free PMC article.
-
The ventilatory responsiveness to CO(2) below eupnoea as a determinant of ventilatory stability in sleep.J Physiol. 2004 Oct 1;560(Pt 1):1-11. doi: 10.1113/jphysiol.2004.072371. Epub 2004 Jul 29. J Physiol. 2004. PMID: 15284345 Free PMC article. Review.
-
Central sleep apnea: pathophysiologic classification.Sleep. 2023 Mar 9;46(3):zsac113. doi: 10.1093/sleep/zsac113. Sleep. 2023. PMID: 35551411 Free PMC article. Review.
Cited by
-
Reduced respiratory neural activity elicits a long-lasting decrease in the CO2 threshold for apnea in anesthetized rats.Exp Neurol. 2017 Jan;287(Pt 2):235-242. doi: 10.1016/j.expneurol.2016.07.020. Epub 2016 Jul 26. Exp Neurol. 2017. PMID: 27474512 Free PMC article.
-
The impact of arousal state, sex, and sleep apnea on the magnitude of progressive augmentation and ventilatory long-term facilitation.J Appl Physiol (1985). 2013 Jan 1;114(1):52-65. doi: 10.1152/japplphysiol.00985.2012. Epub 2012 Nov 8. J Appl Physiol (1985). 2013. PMID: 23139361 Free PMC article.
-
Sleep state dependence of ventilatory long-term facilitation following acute intermittent hypoxia in Lewis rats.J Appl Physiol (1985). 2010 Aug;109(2):323-31. doi: 10.1152/japplphysiol.90778.2008. Epub 2010 Apr 1. J Appl Physiol (1985). 2010. PMID: 20360430 Free PMC article.
-
Sleep disordered breathing in chronic spinal cord injury.J Clin Sleep Med. 2014 Jan 15;10(1):65-72. doi: 10.5664/jcsm.3362. J Clin Sleep Med. 2014. PMID: 24426822 Free PMC article.
-
Control of Ventilation in Health and Disease.Chest. 2017 Apr;151(4):917-929. doi: 10.1016/j.chest.2016.12.002. Epub 2016 Dec 19. Chest. 2017. PMID: 28007622 Free PMC article. Review.
References
-
- Aboubakr SE, Taylor A, Ford R, Siddiqi S, Badr MS. Long-term facilitation in obstructive sleep apnea patients during NREM sleep. J Appl Physiol 91: 2751–2757, 2001 - PubMed
-
- Ainslie PN, Kolb JC, Ide K, Poulin MJ. Effects of five nights of normobaric hypoxia on the ventilatory responses to acute hypoxia and hypercapnia. Respir Physiol Neurobiol 138: 193–204, 2003 - PubMed
-
- Ainslie PN, Duffin J. Integration of cerebrovascular CO2 reactivity and chemoreflex. Control of breathing: mechanisms of regulation, measurement, and interpretation. Am J Physiol Regul Integr Comp Physiol 296: R1473–R1495, 2009 - PubMed
-
- Babcock MA, Badr MS. Long-term facilitation of ventilation in humans during NREM sleep. Sleep 21: 709–716, 1998 - PubMed
-
- Babcock M, Shkoukani M, Aboubakr SE, Badr MS. Determinants of long-term facilitation in humans during NREM sleep. J Appl Physiol 94: 53–59, 2003 - PubMed
Publication types
MeSH terms
Substances
LinkOut - more resources
Full Text Sources
Miscellaneous