. 2010 Mar 5;285(10):7222-32.
doi: 10.1074/jbc.M109.073429. Epub 2009 Nov 25.

TILRR, a novel IL-1RI co-receptor, potentiates MyD88 recruitment to control Ras-dependent amplification of NF-kappaB

Affiliations

TILRR, a novel IL-1RI co-receptor, potentiates MyD88 recruitment to control Ras-dependent amplification of NF-kappaB

Xiao Zhang et al. J Biol Chem. .

Erratum in

  • J Biol Chem. 2010 Jun 4;285(23):18122

Abstract

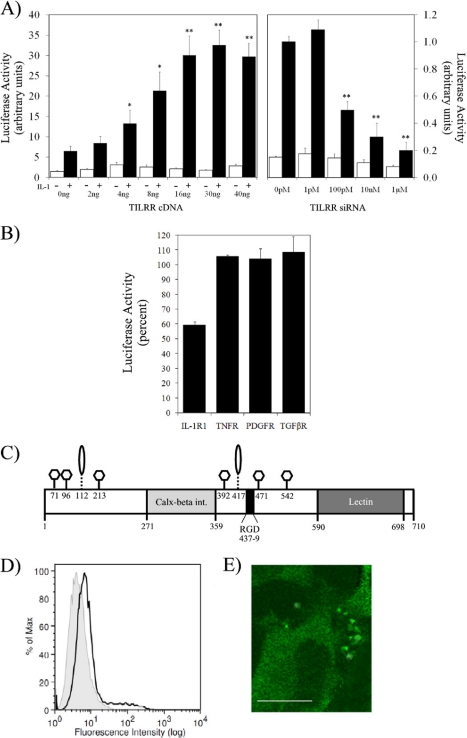
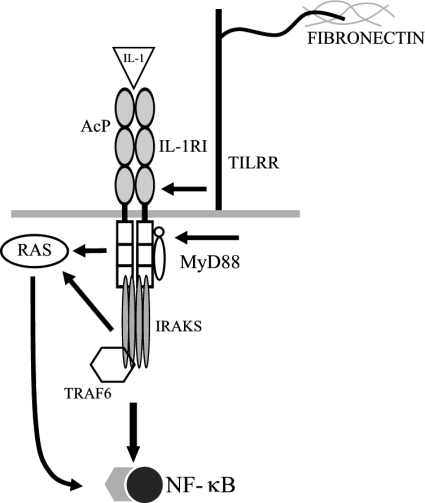
Host defense against infection is induced by Toll-like and interleukin (IL)-1 receptors, and controlled by the transcription factor NF-kappaB. Our earlier studies have shown that IL-1 activation impacts cytoskeletal structure and that IL-1 receptor (IL-1RI) function is substrate-dependent. Here we identify a novel regulatory component, TILRR, which amplifies activation of IL-1RI and coordinates IL-1-induced control with mechanotransduction. We show that TILRR is a highly conserved and widely expressed enhancer of IL-1-regulated inflammatory responses and, further, that it is a membrane-bound glycosylated protein with sequence homology to members of the FRAS-1 family. We demonstrate that TILRR is recruited to the IL-1 receptor complex and magnifies signal amplification by increasing receptor expression and ligand binding. In addition, we show that the consequent potentiation of NF-kappaB is controlled through IL-1RI-associated signaling components in coordination with activation of the Ras GTPase. Using mutagenesis, we demonstrate that TILRR function is dependent on association with its signaling partner and, further, that formation of the TILRR-containing IL-1RI complex imparts enhanced association of the MyD88 adapter during ligand-induced activation of NF-kappaB. We conclude that TILRR is an IL-1RI co-receptor, which associates with the signaling receptor complex to enhance recruitment of MyD88 and control Ras-dependent amplification of NF-kappaB and inflammatory responses.


Figures

FIGURE 1.
FIGURE 1.
TILRR is a widely expressed protein of 70–80 kDa. A, the TILRR core protein sequence. Shown is the amino acid sequence of mouse and human TILRR protein identified from partial trypsin digests of mouse epithelial cells (C127). Samples were purified by immunoprecipitation and SDS-PAGE and analyzed by MALDI-TOF and using Profound, MASCOT, MOWSE, and PeptIdent. *, methionine at residue 7. B, TILRR mRNA is expressed in a variety of cell lines. RNA extracted from various cell lines and primary human periferal mononuclear cells (PBMC 1 and 2), was used to synthesize a first strand cDNA. TILRR and glyceraldehyde-3-phosphate dehydrogenase (human) or actin (mouse) mRNAs were quantitated using quantitative RT-PCR. Data are expressed relative to glyceraldehyde-3-phosphate dehydrogenase and actin, respectively, and represent mean ± S.E. of two experiments. C, the TILRR core is a 70–80-kDa protein. Total protein was extracted from a range of cell lines, as indicated, followed by separation using SDS-PAGE (8%). Levels of TILRR were determined by Western analysis using a TILRR-specific polyclonal antibody (1:1000) or secondary antibody alone (control), followed by horseradish peroxidase-conjugated secondary antibody (1:5000), and visualized by ECL. Levels of β-actin were similarly determined by incubating with an anti-actin antibody (1:1000) and used as a loading control. A representative gel from one of four experiments is shown.
FIGURE 2.
FIGURE 2.
TILRR is a cell surface glycosylated protein, which potentiates IL-1RI activities. A, TILRR expression correlates with TIR-induced gene activity. HeLa cells were co-transfected with pIL-8-luc (0.2 μg/well (34 μg/106)) and TK-RL (0.075 μg/well (13 μg/106)) together with TILRR cDNA (0–40 ng/well (0–7 μg/106 cells)) or empty vector (control) (left panel). Other cultures were transfected with pIL-8-luc and TK-RL, as above, together with increasing levels of TILRR siRNA, or random siRNA (control), as indicated (right panel). Cells were incubated in the absence (□) or presence (■) of IL-1 (1 nm, 6 h), and luciferase activity was measured. Data are expressed relative to levels in unstimulated cells transfected with the relevant concentrations of empty vector or random siRNA and show mean ± S.E. of two experiments. *, p < 0.05; **, p < 0.01. B, TILRR uniquely regulates IL-1RI function. HeLa cells were used to screen a series of receptor systems (IL-1RI, TNFR, PDGFR, TGFβR) for effects of TILRR on IL-8 promoter activity. Cells were transfected with random or TILRR-specific siRNA (100 pm) and stimulated with respective ligand at saturated levels (IL-1β (1 nm), TNFα (10 ng/ml), PDGF (25 ng/ml), TGFβ (3 ng/ml)). Data are expressed as percentage of activation in the presence of the relevant control (containing Random siRNA) and demonstrate effects on IL-1RI function only. C, schematic outline of the TILRR core protein. The protein contains a GPI anchor in its C-terminal lectin domain, GAG attachment sites (ovals), multiple N-linked glycosylation sites (hexagons), and an integrin-binding site (RGD). D and E, TILRR is localized at the cell surface. D, HeLa cells (106 cells/10-cm dish) were plated for 48 h and then fixed (2% paraformaldehyde on ice) and stained using normal rabbit IgG (control, gray) or a TILRR specific polyclonal antibody (white), followed by a fluorescein isothiocyanate-tagged secondary antibody, and analyzed by flow cytometry. Data show one experiment of four. E, confocal micrograph of HeLa cells transfected with EGFP-TILRR (0.6 μg/well (12 μg/106 cells)). Shown is a representative micrograph demonstrating cell surface localization of the TILRR fusion protein. Bar, 3 μm.
FIGURE 3.
FIGURE 3.
TILRR controls TIR-induced inflammatory gene activation by IL-1 in various cell types. A, TILRR signals through Box 1 of the TIR domain. HeLa cells were co-transfected with pIL-8-luc (34 μg/106) and TK-RL (13 μg/106) and wild type (WT) or TIR domain mutants of IL-1RI (22 μg/106 cells), in the presence of TILRR-specific siRNA (+) or random siRNA (−) at 100 pm, stimulated (IL-1β1 nm, 6 h), and assayed for luciferase activity. Data show effects of mutants, as described previously (17), and reduced activities through the wild-type receptor and the Box 2 mutants in the presence of TILRR siRNA and represent mean ± S.E. of two experiments. *, p < 0.05. B, TILRR activation is controlled through IL-1RI regulatory components IRAK1 and TRAF6. Cells transfected with IL-8-luc, as above, and with DDIRAK1 (6 μg/106 cells) or DNTRAF6 (6 μg/106 cells), in the presence or absence of TILRR cDNA (3 μg/106 cells), as indicated, were stimulated with IL-1β (1 nm, 6 h). Data show mean ± S.E. of two experiments. **, p < 0.01. C–E, TILRR controls IL-1RI-induced gene regulation in a variety of cells. C, cells (black, Raw 264.7; gray, C127; white, 3T3) were co-transfected with pIL-8-luc (34 μg/106) and TK-RL (13 μg/106) and random- or TILRR-specific siRNA (100 pm, 1 nm), as indicated, and stimulated with IL-1 (1 nm, 6 h), and luciferase activity was measured. Random siRNA had no impact over a range of concentrations. Data are expressed relative to levels in mock-transfected, unstimulated cells and show mean ± S.E. of two experiments. *, p < 0.05; **, p < 0.01. D, endothelial cells were transfected with IL-8-EGFP (40 μg/106 cells) and random siRNA (100 pm) (♦) or TILRR siRNA (100 pm) (■). Single cell images were obtained by continuous recording during stimulation (IL-1, 1 nm), and cytoplasmic fluorescence was determined at the time points indicated, using NIH Image. Data, averaging readings from two experiments, including 30 cells, are expressed relative to initial cytoplasmic levels, S.E. ± 7%, p < 0.01 at 6–8 h. E, human endothelial cells (HMEC-1; left) and primary gingival fibroblasts (right) were transfected with TILRR-specific siRNA (0 pm, 100 pm, and 1 nm), as indicated, and stimulated with IL-1 (1 nm, 6 h), and levels of IL-6 determined by an enzyme-linked immunosorbent assay. Random siRNA had no impact over a range of concentrations. Data show levels of protein synthesized by 106 cells transfected with siRNA and represent mean ± S.E. of two experiments per graph. *, p < 0.05; **, p < 0.005.
FIGURE 4.
FIGURE 4.
TILRR controls cell structure and activates the Ras GTPase to potentiate IL-1RI-induced NF-κB. A, TILRR controls IL-1-induced IκBα phosphorylation. HeLa cells were transfected with random (■) or TILRR siRNA (▴) (100 pm) and stimulated (IL-1, 1 nm) for the times indicated and analyzed by Western blotting, using a phosphospecific anti-IκBα antibody or anti-β-actin (loading control). Data are expressed relative to levels in unstimulated samples for each condition and represent mean ± S.E. of two experiments, p < 0.05 at the 5 min peak. B, TILRR controls IL-1-induced IκBα degradation. Confocal micrographs of HeLa cells were transfected with IκBα-EGFP (17 μg/106 cells) alone or in the presence of random or TILRR-specific siRNA (100 pm) and stimulated with IL-1 (1 nm). Quantitation, using NIH Image or Image J, shows levels of IκBα-EGFP cytoplasmic fluorescence in the presence of TILRR siRNA (■) or in the absence of siRNA (♦) indistinguishable from those measured in the presence of random siRNA. Data are from three experiments, including 55 cells, S.E. ± 10–25%, p < 0.05 at 60 min. Bar, 10 μm. C, IL-1-induced changes in cell structure are controlled by TILRR. Cells were transfected with TILRR cDNA, siRNA, or the dominant negative N17Ras and incubated with medium alone or IL-1 (1 nm, 1 h), as indicated. Following fixation, actin filaments were stained using rhodamine-tagged phalloidin, and samples were analyzed by confocal microscopy. The experiments demonstrate that in unstimulated cells (panels 1–3) TILRR cDNA causes pronounced cell rounding with reductions in cell size and extended processes (arrows, compare panels 1 and 2), whereas cells transfected with the dominant negative N17Ras have an appearance similar to that of mock-transfected cells (arrows, compare panels 1 and 3). Further, the data show that these changes (arrows) are induced by IL-1 (compare panels 1 and 4) but do not occur during stimulation in the presence of TILRR siRNA or N17Ras, where cells demonstrate an appearance similar to that observed in unstimulated mock-transfected cultures (compare panels 5 and 6 with panel 1). Bar, 2 μm. D, TILRR amplification is regulated through the Ras GTPase. Cells were co-transfected with pIL-8-luc (34 μg/106 cells) and TK-RL (13 μg/106 cells) alone (−) or together with TILRR cDNA (+) (4 μg/106 cells) and increasing levels of N17Ras, as indicated, and incubated in medium alone or stimulated with IL-1 (1 nm, 6 h). Data are expressed relative to activity in mock-transfected, unstimulated samples and represent mean ± S.E. of two experiments. *, p < 0.05; **, p < 0.01. E, TILRR controls IL-1RI-induced Ras activation. Cells were plated on fibronectin, transfected with random (♦) or TILRR-specific (■) siRNA (100 pm), and stimulated with IL-1 (1 nm) for various times, as indicated. Immunoprecipitated active Ras was detected by Western blot and quantitated by NIH Image, and data were expressed relative to levels in unstimulated cultures, using actin as the loading control, and represent Mean ± S.E. of two experiments, p < 0.05 at 2.5 min.
FIGURE 5.
FIGURE 5.
TILRR controls IL-1RI function by increasing ligand binding and receptor complex levels. A, TILRR expression controls ligand binding. HeLa cells were plated on fibronectin and transfected with random (▿) or TILRR siRNA (100 pm) (▴). Specific cell surface receptor binding was determined by incubating with radiolabeled 125I-IL-1 (2 h, 4 °C) at the concentrations indicated (S.E. ± 7%). B, TILRR expression controls formation of a 300–350-kDa IL-1RI complex. HeLa cells, plated on fibronectin and transfected with TILRR siRNA or random siRNA (100 pm) as in (A), were incubated with 125I-IL-1 (1 nm, 2 h, 4 °C) and cross-linked using bis(sulfosuccinimidyl)suberate, and extracts were analyzed by SDS-PAGE (8%). One experiment of three is shown (S.E. ± 7%). C, TILRR and IL-1RI associate to form a 300–350-kDa complex. HeLa cells transfected with empty vector (Mock) or TILRR cDNA (10 μg/106 cells) or TILRR siRNA (100 pm) and incubated (IL-1, 1 nm) as in A and B, were cross-linked and immunoprecipitated with an anti-IL-1RI antibody (2 μg/ml) and analyzed by SDS-PAGE (4–12%). Levels of TILRR and IL-1RI were determined by Western blotting, using IgG as the loading control. One representative gel is shown. D, TILRR control of IL-1RI function is dependent on the structure of the signaling receptor extracellular domain. Cells were co-transfected with pIL-8-luc (34 μg/106 cells), TK-RL (13 μg/106 cells), wild type TILRR (3.6 μg/106 cells), and wild type or mutant IL-1RI (22 μg/106 cells), as indicated, and stimulated with IL-1 (1 nm, 6 h), and extracts were assayed for luciferase activity. Data are expressed relative to activation in mock-transfected, IL-1-stimulated samples and represent mean ± S.E. of two experiments. *, p < 0.01; **, p < 0.001. E, TILRR function is dependent on association with IL-1RI. Cells were transfected with a mock construct or wild type TILRR (10 μg/106 cells) together with wild type IL-1RI (WT) or the N319A IL-1RI mutant (10 μg/106 cells), as indicated, and incubated with 125I-IL-1 (1 nm, 2 h, 4 °C), and cross-linked extracts were analyzed by SDS-PAGE. Quantitation of levels of the high molecular weight complex was carried out using scanned autoradiograms and NIH Image, and data are expressed relative to levels of the 97 kDa band (IL-1RI + ligand) and represent mean ± S.E. of two experiments. **, p < 0.01.
FIGURE 6.
FIGURE 6.
TILRR controls MyD88-dependent signaling and MyD88 association. A, TILRR function is dependent on the structure of its core protein. HeLa cells were co-transfected with wild type (WT) or mutant TILRR (3.6 μg/106 cells), together with pIL-8-luc (34 μg/106 cells) and TK-RL (13 μg/106 cells), and stimulated with IL-1 (1 nm, 6 h), and luciferase activity was measured. Data are expressed relative to activity in mock-transfected cells and represent mean ± S.E. of two experiments. *, p < 0.05; **, p < 0.001. B, functionally impaired TILRR mutants do not associate with IL-1RI. HeLa cells were transfected with empty vector (Mock) or wild type TILRR or D448 TILRR (10 μg/106 cells), as indicated, and incubated with 125I-IL-1 (1 nm, 2 h, 4 °C) and cross-linked bis(sulfosuccinimidyl)suberate, and extracts were analyzed by SDS-PAGE. Quantitation of scanned autoradiograms by NIH Image shows levels of the high molecular weight, TILRR-containing complex, expressed relative to levels of the 97 kDa band (IL-1 RI + ligand) and represent mean ± S.E. of two experiments. *, p < 0.05. C, TILRR amplification of IL-1RI responses is MyD88-dependent. HeLa cells were co-transfected with pIL-8-luc (34 μg/106 cells) and TK-RL (13 μg/106 cells) in the presence of TILRR cDNA (11 μg/106 cells) or the relevant mock construct and increasing concentrations of DN MyD88, as indicated, stimulated with IL-1 (1 nm, 6 h), and assayed for luciferase activity. Data are expressed relative to activity in mock-transfected, unstimulated cells and represent mean ± S.E. of two experiments. *, p < 0.01; **, p < 0.001. D, TILRR increases association of MyD88 with IL-1RI. HeLa cells transfected with empty vector (Mock) or TILRR cDNA (TILRR, 10 μg/106cells) were stimulated with IL-1 (1 nm) for 0 (−) or 20 (+) min, as indicated, subjected to membrane-permeable cross-linking (DSS), immunoprecipitated using an IL-1RI antibody (2 μg/ml), and analyzed by SDS-PAGE (4–12%). Levels of MyD88 and IL-1RI were determined by Western blotting, using IgG as the loading control. One representative gel is shown. Quantitation was done using NIH Image, and data are expressed as levels of MyD88 relative to IL-1RI for each condition and represent mean ± S.E. of two experiments. *, p < 0.05; **, p < 0.001.
FIGURE 7.
FIGURE 7.
TILRR enhances MyD88 recruitment to IL-1RI to coordinate TIR- and Ras-dependent activation. TILRR association with IL-1RI increases ligand binding and receptor complex formation and potentiates recruitment of the MyD88 adapter to the TIR domain to increase signal amplification at the level of the receptor complex and associated regulatory components and to direct activation of the Ras GTPase and magnify induction of NF-κB and inflammatory genes.

Similar articles

Cited by

References

    1. Akira S., Takeda K. (2004) Nat. Rev. Immunol. 4, 499–511 - PubMed
    1. Beutler B. (2004) Nature 430, 257–263 - PubMed
    1. O'Neill L. A. (2006) Curr. Opin. Immunol. 18, 3–9 - PubMed
    1. Gay N. J., Gangloff M. (2007) Annu. Rev. Biochem. 76, 141–165 - PubMed
    1. Dinarello C. A. (2005) J. Exp. Med. 201, 1355–1359 - PMC - PubMed

Publication types

MeSH terms