. 2010 Jan 29;285(5):3428-38.
doi: 10.1074/jbc.M109.074252. Epub 2009 Nov 24.

Adipocyte apoptosis, a link between obesity, insulin resistance, and hepatic steatosis

Affiliations

Adipocyte apoptosis, a link between obesity, insulin resistance, and hepatic steatosis

Naim Alkhouri et al. J Biol Chem. .

Abstract

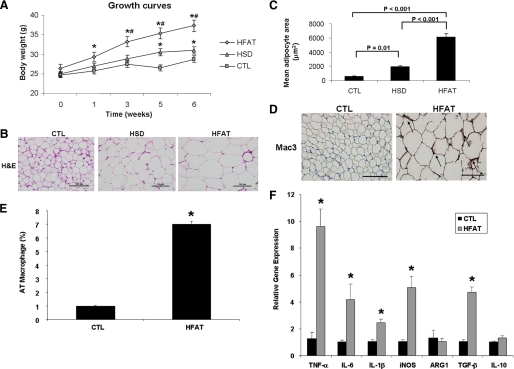
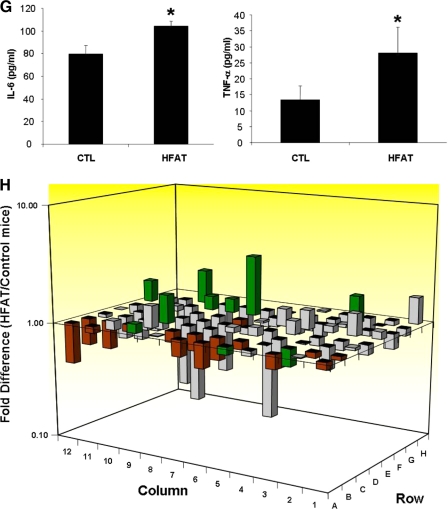
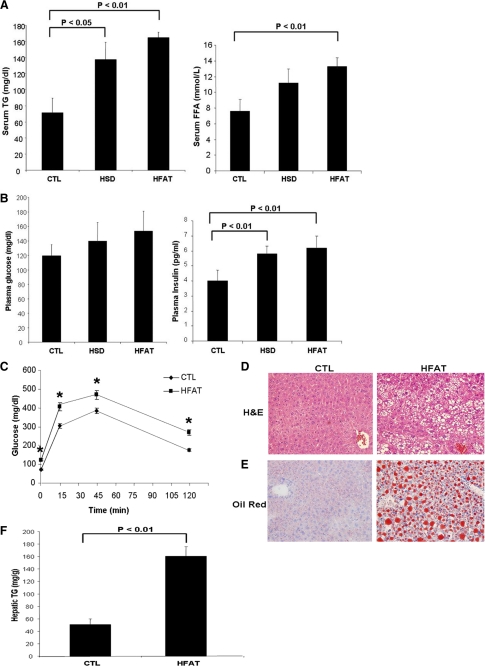
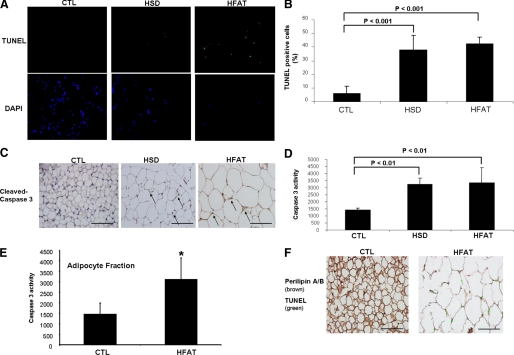
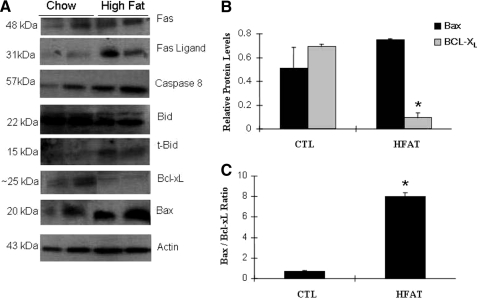
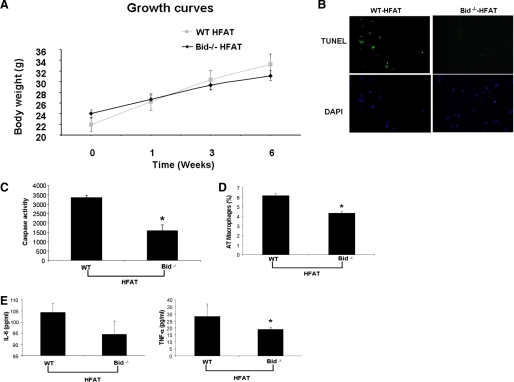
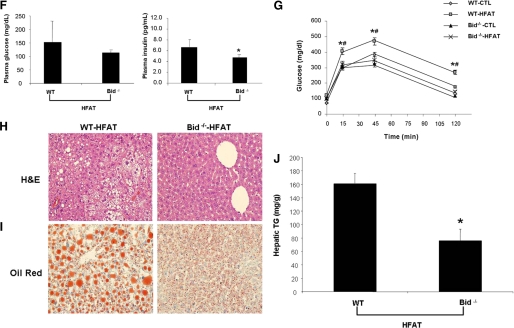
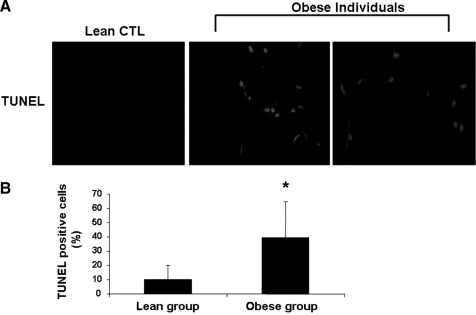
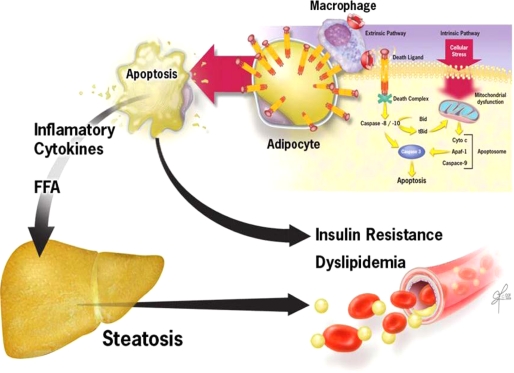
Adipocyte death has been reported in both obese humans and rodents. However, its role in metabolic disorders, including insulin resistance, hepatic steatosis, and inflammation associated with obesity has not been studied. We now show using real-time reverse transcription-PCR arrays that adipose tissue of obese mice display a pro-apoptotic phenotype. Moreover, caspase activation and adipocyte apoptosis were markedly increased in adipose tissue from both mice with diet-induced obesity and obese humans. These changes were associated with activation of both the extrinsic, death receptor-mediated, and intrinsic, mitochondrial-mediated pathways of apoptosis. Genetic inactivation of Bid, a key pro-apoptotic molecule that serves as a link between these two cell death pathways, significantly reduced caspase activation, adipocyte apoptosis, prevented adipose tissue macrophage infiltration, and protected against the development of systemic insulin resistance and hepatic steatosis independent of body weight. These data strongly suggest that adipocyte apoptosis is a key initial event that contributes to macrophage infiltration into adipose tissue, insulin resistance, and hepatic steatosis associated with obesity in both mice and humans. Inhibition of adipocyte apoptosis may be a new therapeutic strategy for the treatment of obesity-associated metabolic complications.


Figures

FIGURE 1.
FIGURE 1.
Adipose tissue expansion, macrophage infiltration, and inflammation during diet-induced obesity are associated with a pro-apoptotic phenotype. A, growth curves of mice on either an HFAT diet, an HSD diet, or a CTL diet (n = 5–6 in each group). B, representative microphotograph of H&E staining of adipose depots from the three groups of animals (magnification ×40). The scale bar represents 100 μm. C, adipocyte size was calculated by determining the mean adipocyte cross-sectional area in adipose tissue depots for each mouse in this study. D, immunohistochemical detection of the macrophage-specific marker Mac3 in epididymal adipose tissue of mice on the CTL and HFAT diet (magnification ×40). E, macrophage infiltration in AT of CTL and HFAT-fed mice was quantitated as the ratio of Mac3-positive cells to total cells. F, expression of genes related to macrophage activation and polarization was measured by quantitative RT-PCR in the AT of CTL and HFAT-fed mice. Results are expressed as mean ± S.D. *, p < 0.001 compared with control diet group. G, protein levels of two key inflammatory cytokines, TNF-α, and IL-6, were measured in adipose tissue lysates from the two groups of mice. Results are expressed as mean ± S.D. *, p < 0.05 compared with control diet group. H, total RNA isolated from adipose tissue of mice on either an HFAT or CTL diet was analyzed using real-time RT-PCR microarrays. Genes related to apoptosis are highlighted in green. Genes associated with anti-apoptotic signaling are highlighted in red. Data are presented as the fold difference from mice on the CTL diet, calculated from average ΔCT normalized to housekeeping genes (β-actin, GAPDH (glyceraldehyde-3-phosphate dehydrogenase), HPRT1, HSP90AB1). Columns pointing up (with z axis values >1) indicate an up-regulation of gene expression, and columns pointing down (with z axis values <1) indicate a down-regulation of gene expression in the test sample relative to the control sample.
FIGURE 1.
FIGURE 1.
Adipose tissue expansion, macrophage infiltration, and inflammation during diet-induced obesity are associated with a pro-apoptotic phenotype. A, growth curves of mice on either an HFAT diet, an HSD diet, or a CTL diet (n = 5–6 in each group). B, representative microphotograph of H&E staining of adipose depots from the three groups of animals (magnification ×40). The scale bar represents 100 μm. C, adipocyte size was calculated by determining the mean adipocyte cross-sectional area in adipose tissue depots for each mouse in this study. D, immunohistochemical detection of the macrophage-specific marker Mac3 in epididymal adipose tissue of mice on the CTL and HFAT diet (magnification ×40). E, macrophage infiltration in AT of CTL and HFAT-fed mice was quantitated as the ratio of Mac3-positive cells to total cells. F, expression of genes related to macrophage activation and polarization was measured by quantitative RT-PCR in the AT of CTL and HFAT-fed mice. Results are expressed as mean ± S.D. *, p < 0.001 compared with control diet group. G, protein levels of two key inflammatory cytokines, TNF-α, and IL-6, were measured in adipose tissue lysates from the two groups of mice. Results are expressed as mean ± S.D. *, p < 0.05 compared with control diet group. H, total RNA isolated from adipose tissue of mice on either an HFAT or CTL diet was analyzed using real-time RT-PCR microarrays. Genes related to apoptosis are highlighted in green. Genes associated with anti-apoptotic signaling are highlighted in red. Data are presented as the fold difference from mice on the CTL diet, calculated from average ΔCT normalized to housekeeping genes (β-actin, GAPDH (glyceraldehyde-3-phosphate dehydrogenase), HPRT1, HSP90AB1). Columns pointing up (with z axis values >1) indicate an up-regulation of gene expression, and columns pointing down (with z axis values <1) indicate a down-regulation of gene expression in the test sample relative to the control sample.
FIGURE 2.
FIGURE 2.
Metabolic abnormalities associated with diet-induced obesity. Metabolic parameters were measured after a 6-h fasting in mice on either an HFAT, HSD, or CTL diet (n = 5 in each group) including: (A) plasma glucose and insulin concentrations; (B) triglycerides, and free fatty acid levels; (C) plasma glucose levels during glucose tolerance test in mice on the CTL and HFAT diet (n = 5 in each group). Data are expressed as mean ± S.D. *, p < 0.01 compared with the control diet group. D, representative microphotograph of H&E staining, and E, Oil Red O staining from mice on the CTL and HFAT diet. F, hepatic triglyceride content was determined in livers from mice on the CTL and HFAT diet and expressed as milligrams per gram of liver tissue.
FIGURE 3.
FIGURE 3.
Adipocyte apoptosis in diet-induced obesity. A, TUNEL staining of adipose tissue sections from C57BL/6 mice on HFAT, HSD, or control diet. The nuclear binding dye DAPI was performed to determine the total number of cells per ×40 field. B, quantitation of TUNEL staining in adipose sections from the three groups of mice by counting the number of TUNEL-positive cells in 10 random microscopic fields. Results are expressed as mean ± S.D. C, representative immunohistochemistry microphotograph of activated caspase 3 in adipose tissue from the three groups of mice. Quantification of caspase activity was determined with Apo-ONE homogeneous caspase 3 fluorometric assay in either (D) whole adipose tissue lysates or (E) lysates from adipocyte fractions following adipocyte isolation as detailed under “Experimental Procedures.” Results are expressed as mean ± S.D. *, p < 0.05 compared with control diet group. F, adipose tissue adipocyte apoptosis was further evaluated in epididymal adipose tissue sections from mice on either CTL or HFAT diet by double immunostaining with perilipin A/B (brown) and with the TUNEL assay to identify apoptotic cells (green).
FIGURE 4.
FIGURE 4.
Extrinsic and intrinsic pathways of apoptosis are activated in adipose tissue from obese mice. A, representative immunoblot analysis for key proteins involved in the signal transduction of the two main apoptotic pathways (extrinsic and intrinsic) in adipose tissue from obese (HFAT) and lean (CTL) mice. β-Actin served as a control for protein loading. B, protein levels were quantified by densitometry analysis and normalized to β-actin. C, BAX/Bcl-XL ratio was calculated (n = 4 in each group of mice) based on the densitometry data. Results are represented as mean ± S.D. *, p < 0.01 compared with CTL.
FIGURE 5.
FIGURE 5.
Inactivation of Bid protects from caspase 3 activation, adipocyte apoptosis, and metabolic complications from diet-induced obesity. A, growth curves of Bid−/− and Bid+/+ mice HFAT diet (n = 5–6 in each group). B, representative microphotograph of TUNEL staining of liver section from Bid−/− and Bid+/+ mice on either the HFAT or control diet. C, quantification of caspase activity was determined with Apo-ONE homogeneous caspase 3 fluorometric assay in adipose tissue lysates. Results are expressed as mean ± S.D. *, p < 0.01 compared with Bid+/+. D, quantification of immunohistochemical detection of the macrophage-specific marker Mac3 in epididymal adipose tissue of Bid−/− and Bid+/+ mice on the HFAT diet. Results are expressed as mean ± S.D. *, p < 0.01 compared with Bid+/+. E, TNF-α and IL-6 protein levels were measured in adipose tissue lysates from Bid−/− and Bid+/+ mice on the HFAT diet. Results are expressed as mean ± S.D. *, p < 0.05 compared with Bid+/+. F, plasma glucose and insulin concentrations from Bid−/− and Bid+/+ mice on the HFAT diet. G, plasma glucose levels during glucose tolerance test in mice on the CTL and HFAT diet (n = 5 in each group). Data are expressed as mean ± S.D. *, p < 0.01 compared with Bid+/+ on the CTL diet. #, p < 0.01 compared with Bid−/− on HFAT diet. Representative microphotograph of (H) H&E staining, and (I) Oil Red O staining from Bid−/− and Bid+/+ mice on HFAT diet. J, hepatic triglyceride content was determined in livers from Bid−/− and Bid+/+ mice on CTL and HFAT diets and expressed as milligrams per gram of liver tissue. Results are expressed as mean ± S.D. *, p < 0.01 compared with Bid+/+ on HFAT diet.
FIGURE 5.
FIGURE 5.
Inactivation of Bid protects from caspase 3 activation, adipocyte apoptosis, and metabolic complications from diet-induced obesity. A, growth curves of Bid−/− and Bid+/+ mice HFAT diet (n = 5–6 in each group). B, representative microphotograph of TUNEL staining of liver section from Bid−/− and Bid+/+ mice on either the HFAT or control diet. C, quantification of caspase activity was determined with Apo-ONE homogeneous caspase 3 fluorometric assay in adipose tissue lysates. Results are expressed as mean ± S.D. *, p < 0.01 compared with Bid+/+. D, quantification of immunohistochemical detection of the macrophage-specific marker Mac3 in epididymal adipose tissue of Bid−/− and Bid+/+ mice on the HFAT diet. Results are expressed as mean ± S.D. *, p < 0.01 compared with Bid+/+. E, TNF-α and IL-6 protein levels were measured in adipose tissue lysates from Bid−/− and Bid+/+ mice on the HFAT diet. Results are expressed as mean ± S.D. *, p < 0.05 compared with Bid+/+. F, plasma glucose and insulin concentrations from Bid−/− and Bid+/+ mice on the HFAT diet. G, plasma glucose levels during glucose tolerance test in mice on the CTL and HFAT diet (n = 5 in each group). Data are expressed as mean ± S.D. *, p < 0.01 compared with Bid+/+ on the CTL diet. #, p < 0.01 compared with Bid−/− on HFAT diet. Representative microphotograph of (H) H&E staining, and (I) Oil Red O staining from Bid−/− and Bid+/+ mice on HFAT diet. J, hepatic triglyceride content was determined in livers from Bid−/− and Bid+/+ mice on CTL and HFAT diets and expressed as milligrams per gram of liver tissue. Results are expressed as mean ± S.D. *, p < 0.01 compared with Bid+/+ on HFAT diet.
FIGURE 6.
FIGURE 6.
Adipocyte apoptosis is increase in human obesity. A, representative microphotograph of TUNEL staining of section from omental fat biopsies from obese subjects (n = 8) undergoing laprascopic bariatric surgery and from lean healthy controls (n = 7) undergoing abdominal surgery for unrelated reasons. B, quantitation of TUNEL staining in adipose sections from the two groups of patients by counting the number of TUNEL-positive cells in 10 random microscopic fields. Results are expressed as mean ± S.D. *, p < 0.01 compared with lean subjects.
FIGURE 7.
FIGURE 7.
Proposed model for role of adipocyte apoptosis in metabolic complications of obesity. During the development of obesity, expansion of adipose tissue results in activation of apoptotic signaling including death receptor and mitochondrial pathways. These cytotoxic signaling pathways result in activation of effector caspases and adipocyte apoptosis. Pathologic increase in apoptosis results in ATM recruitment, with subsequent development of insulin resistance, hepatic steatosis, and dyslipidemia. Anti-apoptotic therapy target at inhibiting either the Fas- or mitochondrial-mediated pathways may be a new therapeutic strategy for treatment of obesity-associated metabolic complications.

Similar articles

Cited by

References

    1. Staels B. (2006) Nat. Med. 12, 54–55 - PubMed
    1. Weiss R., Dziura J., Burgert T. S., Tamborlane W. V., Taksali S. E., Yeckel C. W., Allen K., Lopes M., Savoye M., Morrison J., Sherwin R. S., Caprio S. (2004) N. Engl. J. Med. 350, 2362–2374 - PubMed
    1. Browning J. D., Horton J. D. (2004) J. Clin. Invest. 114, 147–152 - PMC - PubMed
    1. Tilg H., Moschen A. R. (2008) Mol. Med. 14, 222–231 - PMC - PubMed
    1. Tilg H., Moschen A. R. (2008) Trends Endocrinol. Metab. 19, 371–379 - PubMed

Publication types