. 2010 Jan 22;285(4):2771-82.
doi: 10.1074/jbc.M109.046508. Epub 2009 Nov 23.

Constitutive activity of the human TRPML2 channel induces cell degeneration

Affiliations

Constitutive activity of the human TRPML2 channel induces cell degeneration

Shaya Lev et al. J Biol Chem. .

Abstract

The mucolipin (TRPML) ion channel proteins represent a distinct subfamily of channel proteins within the transient receptor potential (TRP) superfamily of cation channels. Mucolipin 1, 2, and 3 (TRPML1, -2, and -3, respectively) are channel proteins that share high sequence homology with each other and homology in the transmembrane domain with other TRPs. Mutations in the TRPML1 protein are implicated in mucolipidosis type IV, whereas mutations in TRPML3 are found in the varitint-waddler mouse. The properties of the wild type TRPML2 channel are not well known. Here we show functional expression of the wild type human TRPML2 channel (h-TRPML2). The channel is functional at the plasma membrane and characterized by a significant inward rectification similar to other constitutively active TRPML mutant isoforms. The h-TRPML2 channel displays nonselective cation permeability, which is Ca(2+)-permeable and inhibited by low extracytosolic pH but not Ca(2+) regulated. In addition, constitutively active h-TRPML2 leads to cell death by causing Ca(2+) overload. Furthermore, we demonstrate by functional mutation analysis that h-TRPML2 shares similar characteristics and structural similarities with other TRPML channels that regulate the channel in a similar manner. Hence, in addition to overall structure, all three TRPML channels also share common modes of regulation.


Figures

FIGURE 1.
FIGURE 1.
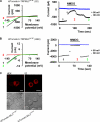
Functional expression of h-TRPML2 in S2 and HEK cells. A, shown are representative I-V curves of h-TRPML2-tdTomato and h-TRPML2-YFP measured from S2 cells by whole-cell patch clamp recordings (Tyrode 0 mm Ca2+ solution). B, shown is a series of confocal images of h-TRPML2-YFP (ML2-YFP) and h-TRPML2-tdTomato (ML2-tdTomato) in S2 and HEK cells, as indicated. Scale bar, 10 μm. C, shown are representative I-V curves of h-TRPML2-tdTomato and h-TRPML2-YFP measured from HEK cells by whole-cell patch clamp recordings (Tyrode wash solution). Note the lack of detectable inward rectifying current from these channels in HEK cells. D, amino acid sequence alignment of human TRPML1, TRPML2, and TRPML3 shows the position of the Va mutation (denoted A424P in h-TRPML2) in each protein. E, top, shown are representative I-V curves of h-TRPML2-A424P-tdTomato measured from HEK cells by whole-cell patch clamp recordings. A typical inward rectification is observed (black, green, and blue (blue and green are superimposed)) curves; Tyrode wash solution) and blocked upon NMDG application (red curve). Inset, although Ca2+ permeates the channel, it permeates to a lesser degree than Na+ (green curve), and at 20 mm external Ca2+ (pink curve), the Erev shifts to a more positive value (inset, green versus pink curves). Bottom, shown are the current values at +100 (blue dots) and −100 mV (black dots) as a function of time. The numbers correspond to the curves presented in the top panel.
FIGURE 2.
FIGURE 2.
h-TRPML2 is not regulated by Ca2+ or LA. A, representative I-V curves measured from S2 cells expressing h-TRPML2-tdTomato (Wash, Tyrode 0 mm Ca2+ solution; Ca2+, Tyrode 5 mm Ca2+ solution). The curves show no Ca2+ dependence or effect on the channel. B, the same I-V curve and lack of Ca2+ dependence is seen also for h-TRPML2-YFP expressed in S2 cells. C is the same as A, showing that LA (60 μm) has no effect on h-TRPML2-tdTomato current. D is the same as A, showing that h-TRPML2 is a nonspecific cation channel that is blocked by the impermeable organic cation, NMDG.
FIGURE 3.
FIGURE 3.
Insertion of pathology inducing mutations derived from TRPML1 and TRPML3 into the TRPML2 channel. A, amino acid sequence alignment of human TRPML1, TRPML2, and TRPML3 shows the position of the denoted h-TRPML2 mutations. B, shown are representative I-V curves measured from S2 cells expressing wild type h-TRPML2-tdtomato (WT) and other mutated isoforms (Tyrode 0 mm Ca2+ solution). Note that wild type h-TRPML2, h-TRPML2-I367T, and h-TRPML2-F457L I-V curves and current amplitudes are similar. C, shown is a histogram presenting the percentage of cells expressing the indicated h-TRPML2-tdTomato channels, which are functional and non-functional, in terms of current amplitude. Note that all h-TRPML2-KK expressing cells are non-functional. D, confocal images of S2 cells expressing the indicated h-TRPML2- tdTomato (ML2) isoforms show similar subcellular distribution. Scale bar, 10 μm.
FIGURE 4.
FIGURE 4.
Low extracellular pH reduces the inward current in native and mutant isoforms of h-TRPML2 expressed in S2 cells. A, shown are representative I-V curves measured from S2 cells expressing wild type h-TRPML2-tdTomato in the indicated pH of extracellular solution. Note that lowering of extracellular pH from 7.15 to a value of 6.0 reduces current amplitude significantly. B is same experiment as in A, with the h-TRPML2-I367T-tdTomato construct. C is the same experiment as in A, with the h-TRPML2-F457L-tdTomato construct. D, shown is a histogram summarizing A–C displaying the normalized inward current of the indicated channels at extracellular pH 6.0 relative to their currents at extracellular pH 7.15. Note that the mean reduction of current is the same for all constructs. E, representative I-V curves measured from HEK cells expressing h-TRPML2-A424P-tdTomato in the indicated pH of extracellular solution are shown.
FIGURE 5.
FIGURE 5.
h-TRPML3-A419P is functional and constitutively active in both S2 and HEK cells. A, left, shown are representative I-V curves measured from S2 cells expressing tdTomato-h-TRPML3-A419P (black and green curves; Tyrode 0 mm Ca2+ solution) by whole-cell patch clamp recordings. The current is inhibited when Na+ is replaced by NMDG (red curve). Right, the current values at +80 (blue dots) and −80 (black dots) mV are shown as a function of time. The numbers correspond to the curves presented in the left panel. B, left, representative I-V curves measured from HEK cells expressing tdTomato-h-TRPML3-A419P (black and green curves; Tyrode wash solution) by whole-cell patch clamp recordings. The current is abolished when Na+ is replaced by NMDG (red curve). Right, the current values at +80 (blue dots) and −80 (black dots) mV are shown as a function of time. The numbers correspond to the curves presented in the left panel. C, confocal images are shown of tdTomato-h-TRPML3-A419P in S2 and HEK cells, as indicated. Scale bar, 10 μm.
FIGURE 6.
FIGURE 6.
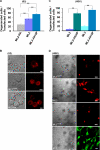
Constitutive activity of both h-TRPML2 and h-TRPML3 results in cellular degeneration. A, shown is a histogram describing the percent of S2 cells expressing the indicated tdTomato-tagged channel types, which also exhibited features of cell degeneration (**, p < 0.01). Note a significantly lower cell degeneration in cells expressing the inactive h-TRPML2-KK-tdTomato channel (ML2-KK). B, representative confocal images show the extent of degeneration observed in terms of morphological aberrations in S2 cells expressing the indicated tdTomato-tagged channels. Note that normal S2 cell morphology is observed in cells expressing the inactive h-TRPML2-tdTomato-KK channel. Scale bar, 5 μm. C, shown is a histogram showing the percent of HEK cells expressing EGFP-h-TRPML3 and the indicated tdTomato-tagged channels, which also exhibited features of cell degeneration (**, p < 0.01). Note the minimal cell degeneration in cells expressing channels that do not display constitutively active currents in HEK cells (h-TRPML2 (ML2) and h-TRPML3 (ML3)). D, representative wide-field confocal images show the extent of degeneration observed in terms of morphological aberrations in HEK cells expressing EGFP-h-TRPML3 and the indicated tdTomato-tagged channels. Note that normal HEK cell morphology is observed in cells expressing h-TRPML2-tdTomato and EGFP-h-TRPML3 channels. Scale bar, 20 μm.
FIGURE 7.
FIGURE 7.
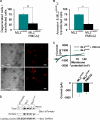
Ca2+ induced degeneration caused by constitutive activity of h-TRPML2-A424P is rescued by the calcium pump PMCA2. A, top, the histogram shows the percent of degenerated HEK cells after co-transfection of h-TRPML2-A424P (ML2A424P) with PMCA2 or empty vector (**, p < 0.01). Note the rescue of cell degeneration in cells co-transfected with h-TRPML2-A424P and PMCA2. A, bottom, wide field confocal images show representative cell morphology in the two groups of co-transfected HEK cells described above (scale bar, 20 μm). B, shown is a histogram showing the percent of annexin V-positive HeLa cells after co-transfection of h-TRPML2-A424P with PMCA2 or empty vector (*, p < 0.05). Note the rescue of cell degeneration in cells co-transfected with h-TRPML2-A424P and PMCA2. C, top, shown are representative I-V curves of h-TRPML2-A424P in HEK cells after co-transfection with PMCA2 or empty vector. Bottom, shown is a histogram of the current amplitude in HEK cells co-transfected with h-TRPML2-A424P and PMCA2 or h-TRPML2-A424P and empty vector. Note that the presence of PMCA2 has no effect on h-TRPML2-A424P-dependent currents. D, surface proteins in transfected HEK cells were biotinylated and subsequently isolated from normalized total cell lysates. Pictured are immunoblots of total lysate (Total) and surface protein (Surface) fractions that were probed for tdTomato-tagged proteins (Blot: tdTomato). The endogenous glyceraldehyde-3-phosphate dehydrogenase protein (Blot: GAPDH) was probed in total lysates as a loading control (Loading Control). Cells were transfected with the tdTomato-tagged constructs, indicated above each column of blots in the presence (+) or absence (-) of PMCA2. Transfection of the tdTomato fluorescent protein alone was used as a negative control for the assay. Note that the presence of PMCA2 bears no effect on the total and surface expression levels of both wild type (ML2) and mutant (ML2A424P) h-TRPML2 proteins.

Similar articles

Cited by

References

    1. Venkatachalam K., Montell C. (2007) Annu. Rev. Biochem. 76, 387–417 - PMC - PubMed
    1. Minke B. (2006) Cell Calcium 40, 261–275 - PMC - PubMed
    1. Ramsey I. S., Delling M., Clapham D. E. (2006) Annu. Rev. Physiol. 68, 619–647 - PubMed
    1. Minke B., Wu C., Pak W. L. (1975) Nature 258, 84–87 - PubMed
    1. Bach G. (2005) Pflugers Arch. 451, 313–317 - PubMed

Publication types