. 2010 Jan 15;285(3):1701-15.
doi: 10.1074/jbc.M109.018184. Epub 2009 Nov 23.

Synthesis of heparan sulfate with cyclophilin B-binding properties is determined by cell type-specific expression of sulfotransferases

Affiliations

Synthesis of heparan sulfate with cyclophilin B-binding properties is determined by cell type-specific expression of sulfotransferases

Audrey Deligny et al. J Biol Chem. .

Abstract

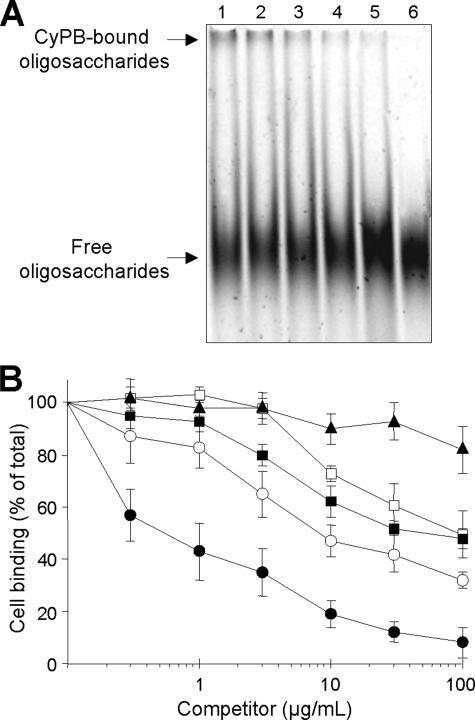
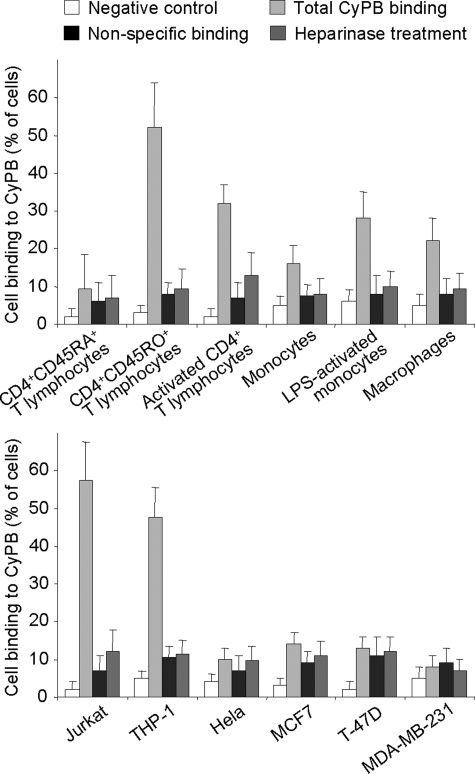
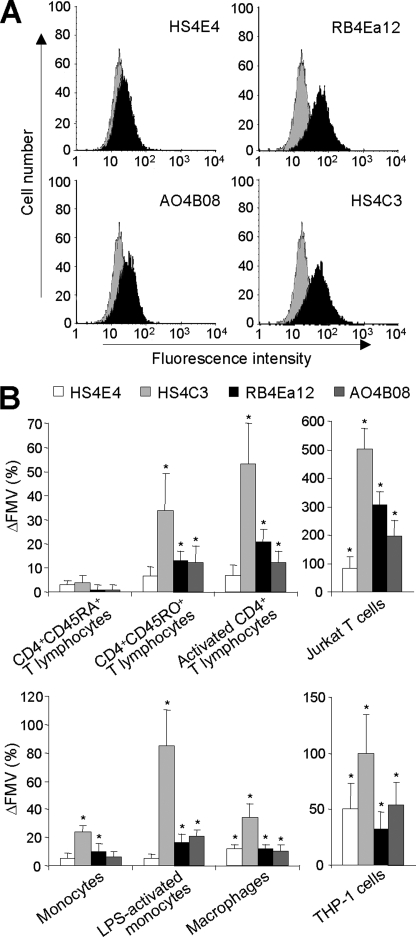
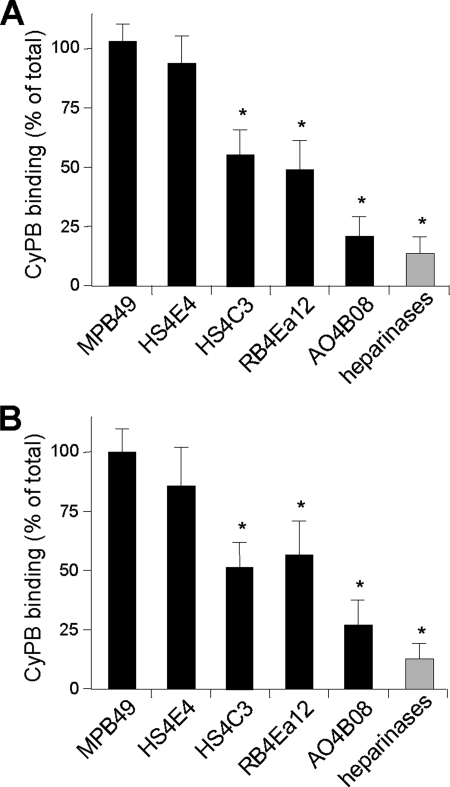
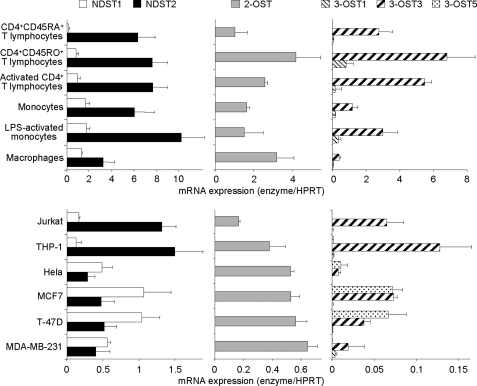
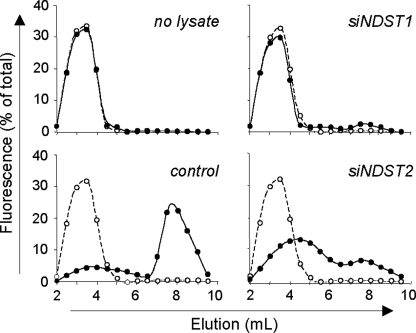
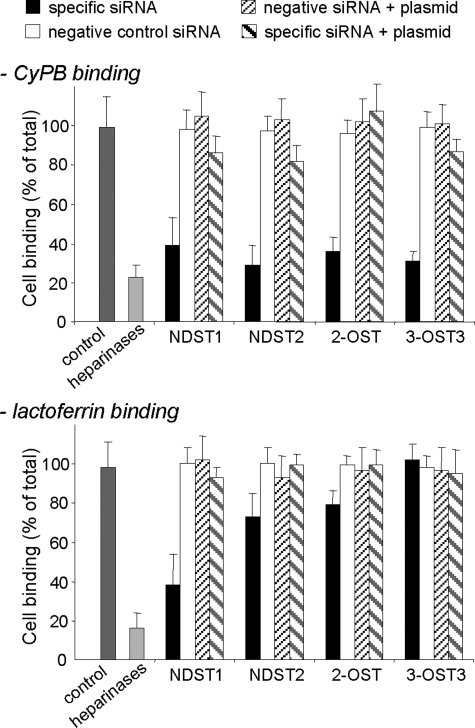
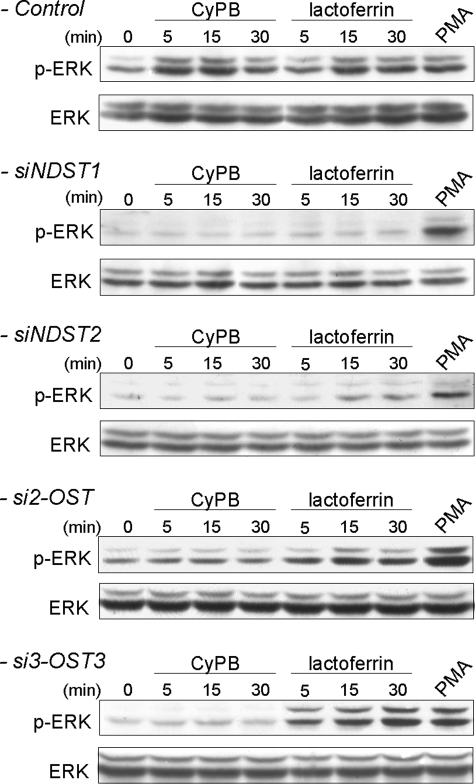
Cyclophilin B (CyPB) induces migration and adhesion of T lymphocytes via a mechanism that requires interaction with 3-O-sulfated heparan sulfate (HS). HS biosynthesis is a complex process with many sulfotransferases involved. N-Deacetylases/N-sulfotransferases are responsible for N-sulfation, which is essential for subsequent modification steps, whereas 3-O-sulfotransferases (3-OSTs) catalyze the least abundant modification. These enzymes are represented by several isoforms, which differ in term of distribution pattern, suggesting their involvement in making tissue-specific HS. To elucidate how the specificity of CyPB binding is determined, we explored the relationships between the expression of these sulfotransferases and the generation of HS motifs with CyPB-binding properties. We demonstrated that high N-sulfate density and the presence of 2-O- and 3-O-sulfates determine binding of CyPB, as evidenced by competitive experiments with heparin derivatives, soluble HS, and anti-HS antibodies. We then showed that target cells, i.e. CD4+ lymphocyte subsets, monocytes/macrophages, and related cell lines, specifically expressed high levels of NDST2 and 3-OST3 isoforms. Silencing the expression of NDST1, NDST2, 2-OST, and 3-OST3 by RNA interference efficiently decreased binding and activity of CyPB, thus confirming their involvement in the biosynthesis of binding sequences for CyPB. Moreover, we demonstrated that NDST1 was able to partially sulfate exogenous substrate in the absence of NDST2 but not vice versa, suggesting that both isoenzymes do not have redundant activities but do have rather complementary activities in making N-sulfated sequences with CyPB-binding properties. Altogether, these results suggest a regulatory mechanism in which cell type-specific expression of certain HS sulfotransferases determines the specific binding of CyPB to target cells.


Figures

FIGURE 1.
FIGURE 1.
Competition of CyPB binding to heparin-derived oligosaccharides and cell surface HS. A, ANTS-labeled dp12 (0.6 nmol) and CyPB (0.1 nmol) were mixed in the absence (control) or presence of heparin derivatives or soluble HS (20 μg). After a 30-min incubation, samples were subjected to electrophoretic mobility shift assay. Lane 1, control; lane 2, fully N-desulfated heparin; lane 3, partially N-desulfated heparin; lane 4, porcine mucosal HS; lane 5, bovine kidney HS; lane 6, unmodified heparin. At the end of the electrophoresis, the profile of migration of ANTS-labeled dp12 was imaged after exposure to UV transilluminator for 0.60 s. Representative gel of three separate experiments is shown. B, inhibition of the interaction of CyPB with cell surface HS was analyzed by measuring the binding of Jurkat T cells to immobilized CyPB (1 μg/well) in the absence (control) or presence of increasing concentrations of heparin derivatives or soluble HS as follows: unmodified heparin (●), partially N-desulfated heparin (■), fully N-desulfated heparin (▴), bovine kidney HS (○), and porcine mucosal HS (□). Cell binding was related to the number of initially added cells (0.8 × 10⁶ per well) remaining fixed to the adhesive substrate. Maximal binding in the absence of competitor was 0.52 ± 0.06 × 10⁶ cells per well. Results are expressed as percentages of this maximal value. Points are means ± S.D. of triplicates from at least three separate experiments.
FIGURE 2.
FIGURE 2.
CyPB binding to primary T lymphocytes subsets, monocytes/macrophages, and cell lines. To analyze the interaction between CyPB and cell surface HS, cells were allowed to adhere to immobilized ligand (1 μg per well) for 45 min at 20 °C. After washing, adherent cells were fixed with 3% (w/v) formaldehyde, stained with 1% (w/v) methylene blue, and lysed with 0.1 m HCl. In control experiments, cells were either allowed to adhere to plastic in the absence of CyPB (negative control), pretreated for 1 h at 37 °C with heparinases (0.2 units/106 cells) prior to adhesion assays, or incubated in the presence of 100 μg/ml soluble CyPB to determine nonspecific binding. Cell adhesion was estimated by using standard curves in which absorbance was related to cell numbers. Results are presented as percentages of initially added cells (8 × 10⁶ per ml for T cell subsets, monocytes/macrophages, Jurkat and THP-1 cells, and 5 × 10⁶ per ml for epithelia cells lines), which remained fixed to the adhesive substrate. Each bar of histograms represents mean ± S.D. of three independent experiments. Statistical significance was determined using the Student's t test, and p values <0.05 were considered as significant.
FIGURE 3.
FIGURE 3.
Detection of cell surface HS on T lymphocytes and monocytes/macrophages. Cells were immunostained with VSV-tagged antibodies to HS epitopes or isotype control. After incubation with mouse anti-VSV and fluorescein-conjugated anti-mouse antibodies, fluorescence was detected by flow cytofluorimetry. A, reactivity of anti-HS antibodies with Jurkat T cells. The black histogram represents staining with anti-HS antibodies, and the gray histogram represents the negative control. Data are representative of three separate experiments. B, detection of cell surface HS on CD4+ T lymphocyte subsets, monocytes/macrophages, Jurkat T cells, and THP-1 cells. Data are expressed as variation of fluorescence mean value (ΔFMV %) and correspond to means ± S.D. from at least three separate experiments obtained with peripheral blood cells from different donors. *, significant difference compared with isotype control (p < 0.05).
FIGURE 4.
FIGURE 4.
Effect of anti-HS antibodies on the interaction of CyPB with cell surface HS. Jurkat T cells (A) and THP-1 cells (B) were preincubated in the presence of anti-HS antibodies or isotype control and allowed to adhere to immobilized CyPB (1 μg/well). Cell binding was related to the number of initially added cells (0.8 × 10⁶ per well) remaining fixed to the adhesive substrate. Heparinase-treated cells were used as a control to estimate the participation of HS in the interaction. Maximal binding obtained in the absence of antibody was estimated at 0.48 ± 0.08 × 10⁶ and 0.33 ± 0.05 × 10⁶ cells per well for Jurkat and THP-1, respectively. Results are normalized to these control values, which were set at 100%. Each bar of the histograms represents the mean ± S.D. of triplicates from three separate experiments. *, significant difference compared with isotype control (p < 0.05).
FIGURE 5.
FIGURE 5.
Expression of mRNAs encoding HS sulfotransferases. Total RNA was extracted from primary CD4+ T lymphocyte subsets, monocytes/macrophages, and various cell lines (Jurkat, THP-1, HeLa, MCF7, T-47D, and MDA-MB-231). Following reverse transcription, variations in the levels of expression of NDST1, NDST2, 2-OST, 3-OST1, 3-OST3, and 3-OST5 transcripts were quantified by real time PCR, as described under “Experimental Procedures.” Relative transcript abundance was normalized to endogenous control hypoxanthine-guanine phosphoribosyltransferase (HPRT) mRNA. Data are means ± S.D. from triplicates and are representative of at least three experiments performed independently.
FIGURE 6.
FIGURE 6.
Contribution of NDST1 and NDST2 to N-sulfotransferase activity in Jurkat T cells. N-sulfotransferase activity was analyzed in siRNA-transfected cells by using an in vitro N-sulfation assay, in which cell lysates were used as enzyme sources to modify fluorescently tagged desulfated dp14. Jurkat T cells (25 × 106/ml) were lysed 48 h post-transfection. The sulfation reaction was performed by incubating cell lysate (100 μg of solubilized proteins) with 5 μg of substrate and 10 μm 3′-phosphoadenosyl-5′-phosphosulfate. Newly modified N-sulfated oligosaccharides were purified and subjected to a deaminative cleavage with HNO2 at pH 1.5, as described under “Experimental Procedures.” The products of deaminative cleavage (●) and parent oligosaccharides (○) were fractionated on Bio-Gel P-6 column (20 × 0.8 cm), and fractions of 500 μl were analyzed for fluorescence. Total fluorescence intensity, relative to N-sulfotransferase activity in cell lysates, was set at 100%. Data are representative of three independent experiments.
FIGURE 7.
FIGURE 7.
Effect of siRNA targeting HS sulfotransferases on the binding of Jurkat T cells to immobilized ligands. Involvement of NDST1, NDST2, 2-OST, and 3-OST3 in the generation of HS motifs with binding properties was analyzed by measuring the interaction of siRNA-treated Jurkat T cells with immobilized CyPB (1 μg/well) or lactoferrin (4 μg/well), 48 h post-transfection. In control experiments, cells were either treated with irrelevant siGFP or negative control siRNA. In rescue experiments, cells were first treated with specific siRNA or corresponding negative control siRNA for 24 h. Thereafter, cells were transfected with plasmids expressing sequences refractory to specific siRNA and used 24 h later for binding experiments. Cell binding was related to the number of initially added cells (0.8 × 10⁶ per well) remaining fixed to the adhesive substrate. The binding of siGFP-treated cells (control) was estimated at 0.45 ± 0.06 × 10⁶ and at 0.31 ± 0.05 × 10⁶ cells per well for CyPB and lactoferrin, respectively. Results are presented as percentages of these maximal values. Heparinase-treated cells were used as a control to estimate the participation of HS in the interaction. Each bar of histograms represents the mean ± S.D. of three independent experiments.
FIGURE 8.
FIGURE 8.
Effect of siRNA targeting HS sulfotransferases on CyPB- and lactoferrin-induced activation of p44/p42 MAPK. The contribution of NDST1, NDST2, 2-OST, and 3-OST3 in the generation of HS motifs with functional properties was analyzed by measuring the activation of p44/p42 MAPK in siRNA-transfected cells, 48 h post-transfection. Jurkat T cells were stimulated in the presence of 50 nm CyPB or 250 nm lactoferrin for various times, and the phosphorylation of ERK1/2 (p-ERK) was analyzed by Western blot. Parallel immunoblotting with anti-total ERK1/2 confirmed equal loading of samples. Phorbol myristate acetate (PMA) was used as a positive control for activation of p44/p42 MAPK in siRNA-transfected cells. Representative results from three independent experiments are shown.

Similar articles

Cited by

References

    1. Handschumacher R. E., Harding M. W., Rice J., Drugge R. J., Speicher D. W. (1984) Science 226, 544–547 - PubMed
    1. Barik S. (2006) Cell. Mol. Life Sci. 63, 2889–2900 - PMC - PubMed
    1. Yurchenko V., O'Connor M., Dai W. W., Guo H, Toole B., Sherry B., Bukrinsky M. (2001) Biochem. Biophys. Res. Commun. 288, 786–788 - PubMed
    1. Allain F., Vanpouille C., Carpentier M., Slomianny M. C., Durieux S., Spik G. (2002) Proc. Natl. Acad. Sci. U.S.A. 99, 2714–2719 - PMC - PubMed
    1. Yurchenko V., Constant S., Bukrinsky M. (2006) Immunology 117, 301–309 - PMC - PubMed

Publication types

MeSH terms