. 2010 Feb 5;285(6):3651-3663.
doi: 10.1074/jbc.M109.068577. Epub 2009 Nov 23.

Hsp70 and CHIP selectively mediate ubiquitination and degradation of hypoxia-inducible factor (HIF)-1alpha but Not HIF-2alpha

Affiliations

Hsp70 and CHIP selectively mediate ubiquitination and degradation of hypoxia-inducible factor (HIF)-1alpha but Not HIF-2alpha

Weibo Luo et al. J Biol Chem. .

Abstract

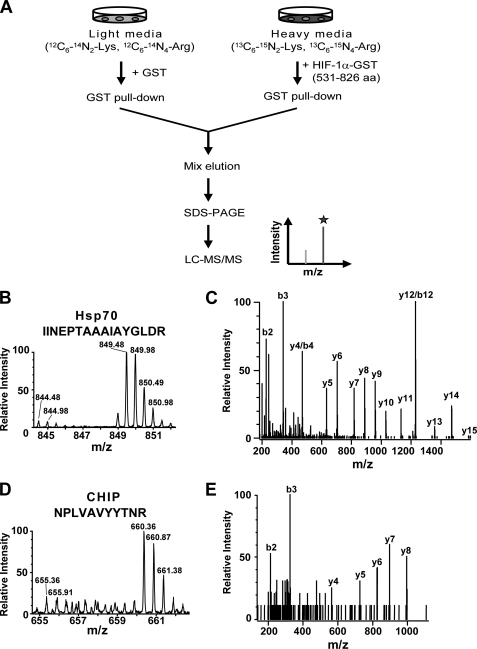
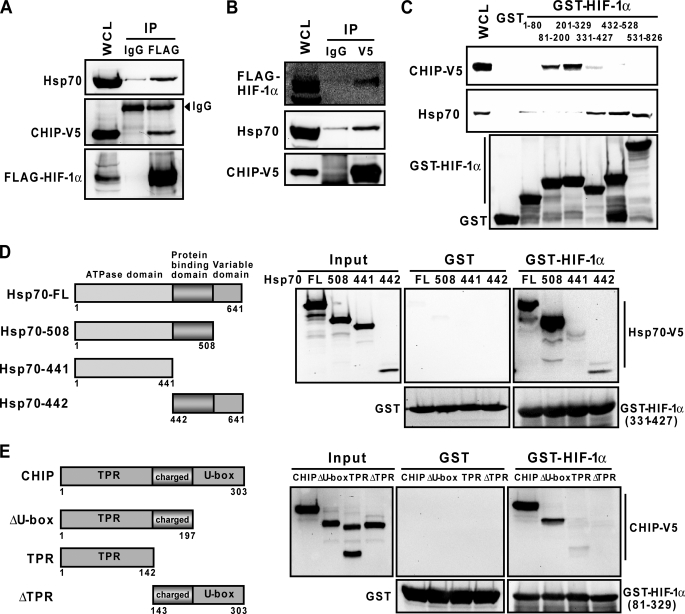
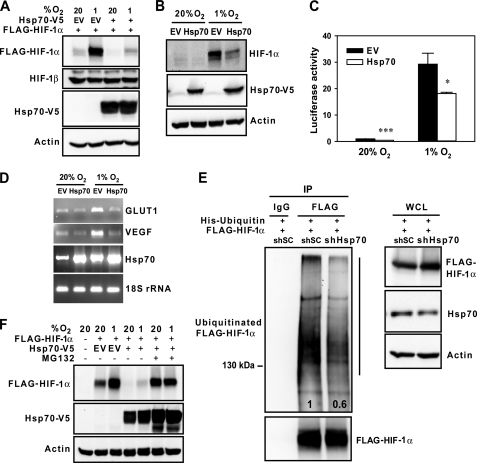
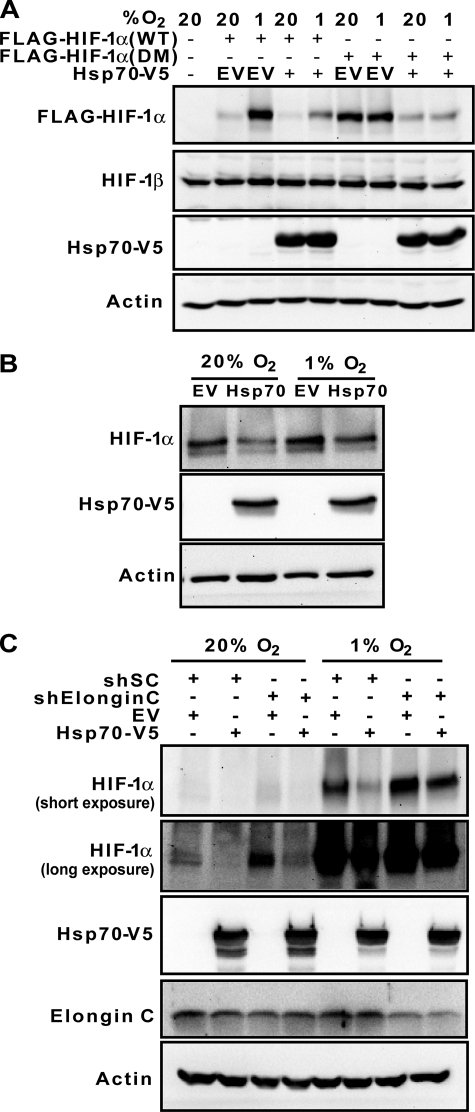
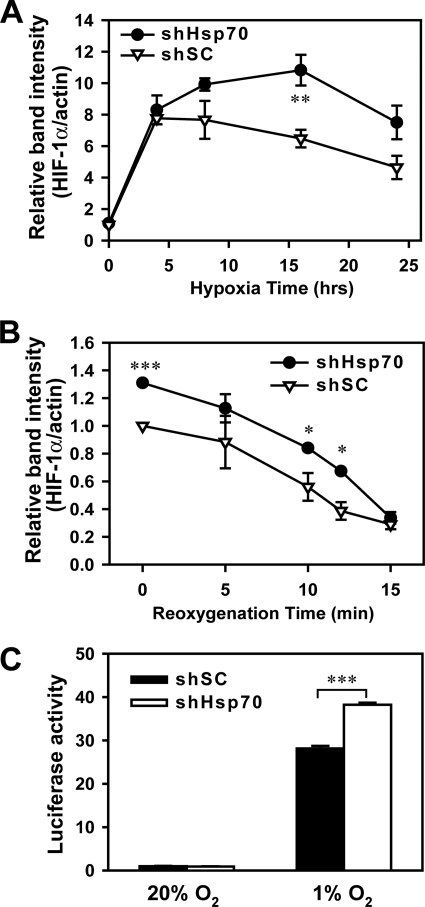
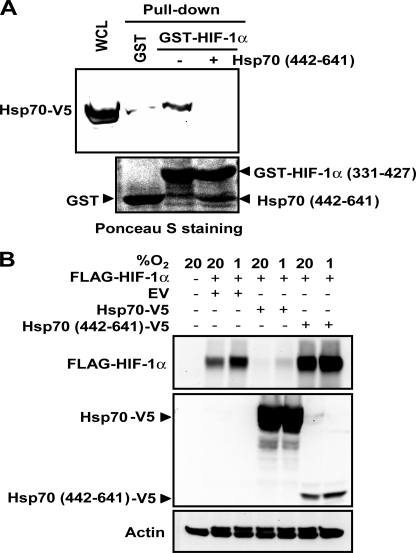
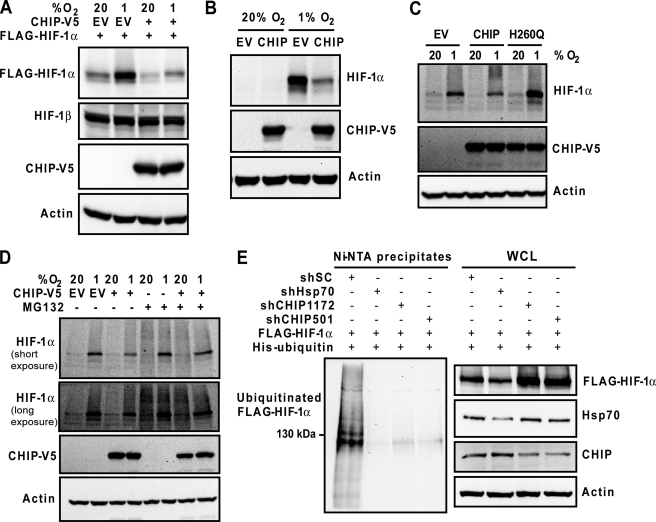
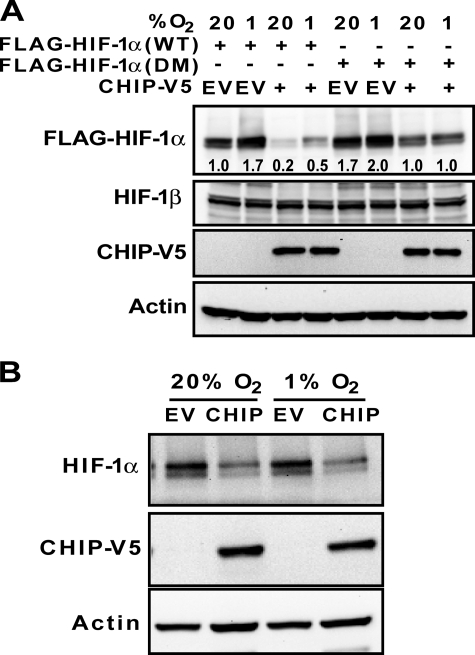
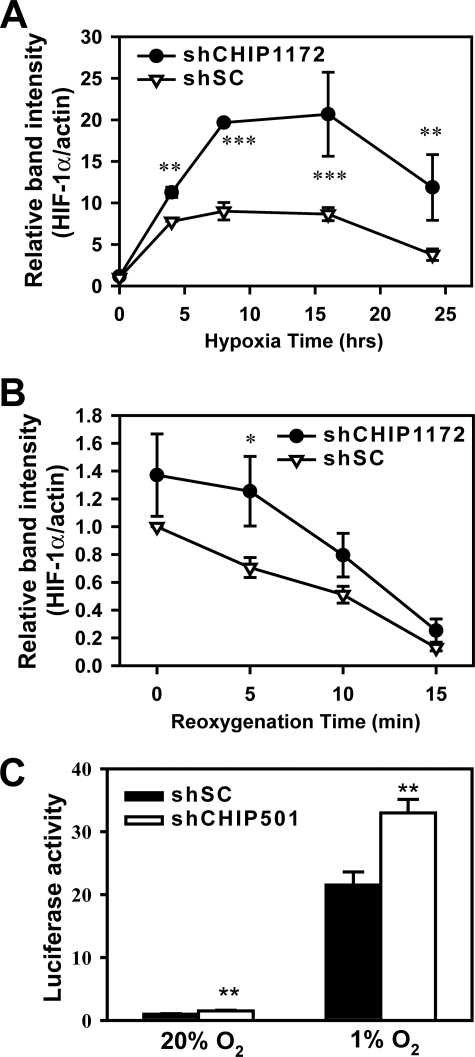
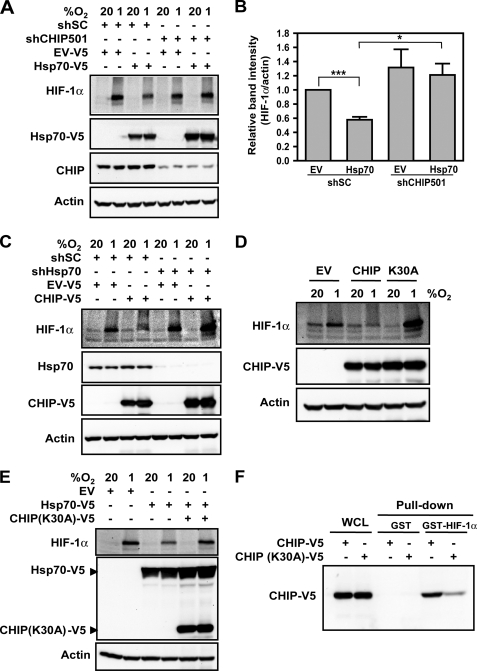
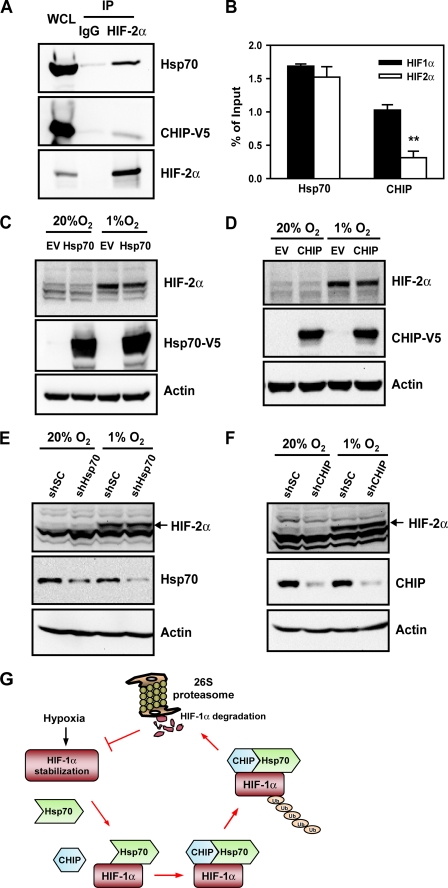
Hypoxia-inducible factors (HIFs) are transcription factors that mediate adaptive responses to reduced oxygen availability. HIF-alpha subunits are stabilized under conditions of acute hypoxia. However, prolonged hypoxia leads to decay of HIF-1alpha but not HIF-2alpha protein levels by unknown mechanisms. Here, we identify Hsp70 and CHIP (carboxyl terminus of Hsc70-interacting protein) as HIF-1alpha-interacting proteins. Hsp70, through recruiting the ubiquitin ligase CHIP, promotes the ubiquitination and proteasomal degradation of HIF-1alpha but not HIF-2alpha, thereby inhibiting HIF-1-dependent gene expression. Disruption of Hsp70-CHIP interaction blocks HIF-1alpha degradation mediated by Hsp70 and CHIP. Inhibition of Hsp70 or CHIP synthesis by RNA interference increases protein levels of HIF-1alpha but not HIF-2alpha and attenuates the decay of HIF-1alpha levels during prolonged hypoxia. Thus, Hsp70- and CHIP-dependent ubiquitination represents a molecular mechanism by which prolonged hypoxia selectively reduces the levels of HIF-1alpha but not HIF-2alpha protein.


Figures

FIGURE 1.
FIGURE 1.
Identification of Hsp70 and CHIP as HIF-1α-interacting proteins. A, proteomic screen was performed to identify HIF-1α-interacting proteins. B, mass spectrum of a tryptic peptide of Hsp70 identified by SILAC was determined. C, fragmentation spectrum of a representative Hsp70 peptide shown in B was determined. D, mass spectrum of a tryptic peptide of CHIP identified by SILAC was determined. E, fragmentation spectrum of a representative CHIP peptide shown in D was determined. For the peptides shown in B and D, the heavy and light forms differ by m/z 5. LC-MS/MS, liquid chromatography-tandem mass spectrometry; aa, amino acids.
FIGURE 2.
FIGURE 2.
Hsp70-CHIP complex binds to HIF-1α in vitro and in human cells. A and B, co-immunoprecipitation (IP) of FLAG-HIF-1α and CHIP-V5 or Hsp70 from transfected HEK293T cells treated with 10 μm MG132 for 8 h was performed. C, GST pulldown assays were performed with purified GST or GST fusion protein containing the indicated amino acid residues of HIF-1α and whole cell lysates (WCLs) from HEK293T cells expressing CHIP-V5. D, GST pulldown assays were performed with purified GST or GST-HIF-1α-(331–427) and WCLs from HEK293T cells expressing full-length (FL) or truncated Hsp70-V5 polypeptides that are illustrated in the left panel. E, GST pulldown assays were performed with purified GST or GST-HIF-1α-(81–329) and WCLs from HEK293T cells expressing full-length or truncated CHIP-V5 polypeptides that are illustrated in the left panel. TPR, tetratricopeptide repeat.
FIGURE 3.
FIGURE 3.
Hsp70 overexpression induces ubiquitination and proteasomal degradation of HIF-1α. A, immunoblot assays were performed to determine FLAG-HIF-1α, HIF-1β, Hsp70-V5, and actin protein levels in co-transfected HEK293T cells exposed to 20% or 1% O2 for 4 h. EV, empty vector. B, immunoblot assays were performed to determine HIF-1α, Hsp70-V5, and actin protein levels in transfected HEK293T cells exposed to 20% or 1% O2 for 4 h. C, HEK293 cells were co-transfected with HIF-1-dependent firefly luciferase reporter p2.1, control reporter pSV-Renilla, and EV or Hsp70-V5 expression vector and exposed to 20% or 1% O2 for 24 h. The ratio of firefly/Renilla luciferase activity was determined and normalized to the nonhypoxic EV condition (mean ± S.E., n = 5). *, p < 0.05; ***, p < 0.001 compared with EV. D, expression of GLUT1, vascular endothelial growth factor (VEGF), and Hsp70 mRNA and 18 S rRNA was analyzed by reverse transcription-PCR in transfected HEK293T cells exposed to 20% or 1% O2 for 24 h. E, HEK293T cells were co-transfected with vectors encoding His-ubiquitin, FLAG-HIF-1α, and Hsp70 shRNA (shHsp70) or scrambled control shRNA (shSC) and treated with 10 μm MG132 for 8 h. Whole cell lysates were used for co-immunoprecipitation (IP). Band intensities of the ubiquitinated HIF-1α species (indicated by vertical bar at right) were quantified by densitometry and normalized to shSC. F, immunoblot assays were performed to determine FLAG-HIF-1α, Hsp70-V5, and actin protein levels in co-transfected HEK293T cells exposed to 20% or 1% O2 for 4 h in the presence or absence of MG132.
FIGURE 4.
FIGURE 4.
PHD/VHL/Elongin-C pathway is not required for Hsp70-mediated HIF-1α degradation. A, immunoblot assays were performed to determine double mutant (DM) FLAG-HIF-1α (P402A/P564A), wild-type (WT) FLAG-HIF-1α, HIF-1β, Hsp70-V5, and actin protein levels in co-transfected HEK293T cells exposed to 20% or 1% O2 for 4 h. B, immunoblot assays were performed to determine HIF-1α, Hsp70-V5, and actin protein levels in transduced RCC4 cells exposed to 20% or 1% O2 for 4 h. C, immunoblot assays were performed to determine HIF-1α, Hsp70-V5, Elongin-C, and actin protein levels in transfected HEK293T cells exposed to 20% or 1% O2 for 4 h. Representative blots from three experiments are shown. shSC, scrambled control shRNA; shElonginC, Elongin-C shRNA.
FIGURE 5.
FIGURE 5.
Hsp70 knockdown increases HIF-1α protein levels and HIF-1-dependent gene transcription during prolonged hypoxia. A, HEK293T cells were transfected with expression vector encoding shRNA against Hsp70 (shHsp70) or a scrambled control shRNA (shSC) and exposed to 20% or 1% O2 for the indicated time. HIF-1α and actin levels were determined by immunoblot assays and quantified by densitometry. The ratio of HIF-1α/actin was normalized to the nonhypoxic shSC condition (mean ± S.E., n = 3). **, p < 0.01, relative to shSC. B, HEK293T cells were transfected with shHsp70 or shSC and exposed to 20% or 1% O2 for 24 h, followed by exposure to 20% O2 for the indicated time. HIF-1α and actin levels were determined by immunoblot assays and quantified by densitometry. The ratio of HIF-1α/actin was normalized to hypoxic shSC group (mean ± S.E., n = 3). *, p < 0.05; ***, p < 0.001, relative to shSC. C, HEK293 cells were co-transfected with p2.1, pSV-Renilla, and expression vector encoding shSC or shHsp70 and exposed to 20% or 1% O2 for 24 h. The ratio of firefly/Renilla luciferase activity was determined and normalized to nonhypoxic shSC condition (mean ± S.E., n = 4). ***, p < 0.001.
FIGURE 6.
FIGURE 6.
Disruption of Hsp70-HIF-1α interaction prevents HIF-1α degradation. A, GST pulldown assays were performed with purified GST or GST-HIF-1α-(331–427) and WCLs from HEK293 cells expressing Hsp70-V5 in the presence or absence of purified Hsp70-(442–641). B, HEK293T cells were co-transfected with vector encoding FLAG-HIF-1α and EV, Hsp70-V5, or Hsp70-(442–641)-V5 and exposed to 20% or 1% O2 for 4 h. WCLs were subjected to immunoblot assays.
FIGURE 7.
FIGURE 7.
CHIP promotes ubiquitination and degradation of HIF-1α. A, immunoblot assays were performed to determine FLAG-HIF-1α, HIF-1β, CHIP-V5, and actin protein levels in co-transfected HEK293T cells exposed to 20% or 1% O2 for 8 h. B, immunoblot assays were performed to determine HIF-1α, CHIP-V5, and actin protein levels in transfected HEK293T cells exposed to 20% or 1% O2 for 8 h. C, immunoblot assays were performed to determine HIF-1α, CHIP-V5, or CHIP (H260Q)-V5 and actin protein levels in transfected HEK293T cells exposed to 20% or 1% O2 for 8 h. D, immunoblot assays were performed to determine HIF-1α, CHIP-V5, and actin protein levels in transfected HEK293T cells exposed to 20% or 1% O2 for 8 h in the presence or absence of 10 μm MG132. E, HEK293T cells were co-transfected with vector encoding His-ubiquitin, FLAG-HIF-1α, shSC, shHsp70, shCHIP1172, or shCHIP501 and treated with MG132 for 8 h. Total ubiquitinated proteins were precipitated from WCLs by Ni-NTA beads and analyzed by immunoblot assay with anti-FLAG antibody.
FIGURE 8.
FIGURE 8.
PHD/VHL pathway is not involved in CHIP-mediated HIF-1α degradation. A, immunoblot assays were performed to determine double mutant (DM) FLAG-HIF-1α(P402A/P564A), wild-type (WT) FLAG-HIF-1α, HIF-1β, CHIP-V5, and actin protein levels in co-transfected HEK293T cells exposed to 20% or 1% O2 for 8 h. Band intensities of FLAG-HIF-1α and actin were quantified by densitometry. The ratio of FLAG-HIF-1α/actin was normalized to nonhypoxic EV condition, as indicated on the blot. B, immunoblot assays were performed to determine HIF-1α, CHIP-V5, and actin protein levels in RCC4 cells that were transduced with lentivirus encoding CHIP or EV and exposed to 20% or 1% O2 for 8 h. Representative blots from three experiments are shown.
FIGURE 9.
FIGURE 9.
CHIP knockdown increases HIF-1α protein levels and HIF-1-dependent gene transcription during prolonged hypoxia. A, HEK293T cells were transfected with expression vector encoding shCHIP1172 or shSC and exposed to 20% or 1% O2 for the indicated time. HIF-1α and actin levels were determined by immunoblot assays and quantified by densitometry. The ratio of HIF-1α/actin was normalized to the nonhypoxic shSC condition (mean ± S.E., n = 3). **, p < 0.01; ***, p < 0.001, relative to shSC. B, HEK293T cells were transfected with expression vector encoding shCHIP1172 or shSC and exposed to 20% or 1% O2 for 24 h, followed by exposure to 20% O2 for the indicated time. HIF-1α and actin levels were determined by immunoblot assays. The ratio of HIF-1α/actin was normalized to the hypoxic shSC condition (mean ± S.E., n = 4). *, p < 0.05, compared with shSC. C, HEK293 cells were co-transfected with HIF-1-dependent firefly luciferase reporter p2.1, control reporter pSV-Renilla, and expression vector encoding shSC or shCHIP501 and exposed to 20% or 1% O2 for 24 h. The ratio of firefly/Renilla luciferase activity was determined and normalized to the nonhypoxic shSC condition (mean ± S.E., n = 4). **, p < 0.01, compared with shSC.
FIGURE 10.
FIGURE 10.
Hsp70 recruits CHIP and regulates HIF-1α degradation. A and B, immunoblot assays were performed to determine HIF-1α, Hsp70-V5, CHIP, and actin protein levels in transfected HEK293T cells exposed to 20% or 1% O2 for 8 h (A). Band intensities of HIF-1α and actin were quantified by densitometry (B). The ratio of HIF-1α/actin was normalized to hypoxic EV group (mean ± S.E., n = 3). *, p < 0.05; ***, p < 0.001. C, immunoblot assays were performed to determine HIF-1α, Hsp70, CHIP-V5, and actin protein levels in transfected HEK293T cells exposed to 20% or 1% O2 for 8 h. D, immunoblot assays were performed to determine HIF-1α, CHIP-V5, or CHIP(K30A)-V5, and actin protein levels in transfected HEK293T cells exposed to 20% or 1% O2 for 8 h. E, immunoblot assays were performed to determine HIF-1α, Hsp70-V5, CHIP(K30A)-V5, and actin protein levels in transfected HEK293T cells exposed to 20% or 1% O2 for 8 h. F, GST pulldown assays were performed with purified GST or GST-HIF-1α and WCLs from HEK293T cells expressing CHIP-V5 or CHIP(K30A)-V5.
FIGURE 11.
FIGURE 11.
Hsp70 and CHIP fail to regulate HIF-2α protein stability. A, co-immunoprecipitation (IP) of HIF-2α and CHIP-V5 or Hsp70 from transfected HEK293T cells treated with 10 μm MG132 for 8 h was performed. B, binding of Hsp70 and CHIP to HIF-2α (as shown in A) or to HIF-1α (as shown in Fig. 2A) was quantified by densitometric analysis of the immunoblots. The band intensity for the precipitated protein was normalized to the band density for the total protein in WCL used for immunoprecipitation (mean ± S.E., n = 3). **, p < 0.01, compared with HIF-1α. C, immunoblot assays were performed to determine HIF-2α, Hsp70-V5, and actin protein levels in transfected HEK293T cells exposed to 20% or 1% O2 for 4 h. D, immunoblot assays were performed to determine HIF-2α, CHIP-V5, and actin protein levels in transfected HEK293T cells exposed to 20% or 1% O2 for 8 h. E, immunoblot assays were performed to determine HIF-2α, Hsp70, and actin protein levels in transfected HEK293T cells exposed to 20% or 1% O2 for 16 h. F, immunoblot assays were performed to determine HIF-2α, CHIP, and actin protein levels in transfected HEK293T cells exposed to 20% or 1% O2 for 16 h. Representative blots from three experiments are shown. G, mechanism by which Hsp70 induces the ubiquitination and degradation of HIF-1α through recruitment of CHIP is shown.

Similar articles

Cited by

References

    1. Wang G. L., Jiang B. H., Rue E. A., Semenza G. L. (1995) Proc. Natl. Acad. Sci. U.S.A. 92, 5510–5514 - PMC - PubMed
    1. Semenza G. L., Wang G. L. (1992) Mol. Cell. Biol. 12, 5447–5454 - PMC - PubMed
    1. Ema M., Taya S., Yokotani N., Sogawa K., Matsuda Y., Fujii-Kuriyama Y. (1997) Proc. Natl. Acad. Sci. U.S.A. 94, 4273–4278 - PMC - PubMed
    1. Gu Y. Z., Moran S. M., Hogenesch J. B., Wartman L., Bradfield C. A. (1998) Gene Expr. 7, 205–213 - PMC - PubMed
    1. Semenza G. L. (2003) Nat. Rev. Cancer 3, 721–732 - PubMed

Publication types

MeSH terms

Substances