. 2010 Jan 29;285(5):3271-81.
doi: 10.1074/jbc.M109.067660. Epub 2009 Nov 23.

Structural determinants of the high affinity extracellular zinc binding site on Cav3.2 T-type calcium channels

Affiliations

Structural determinants of the high affinity extracellular zinc binding site on Cav3.2 T-type calcium channels

Ho-Won Kang et al. J Biol Chem. .

Abstract

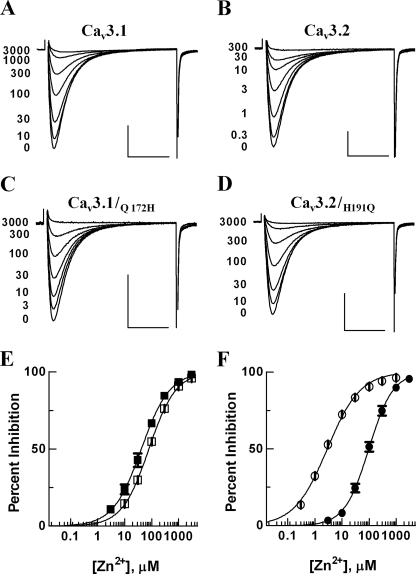
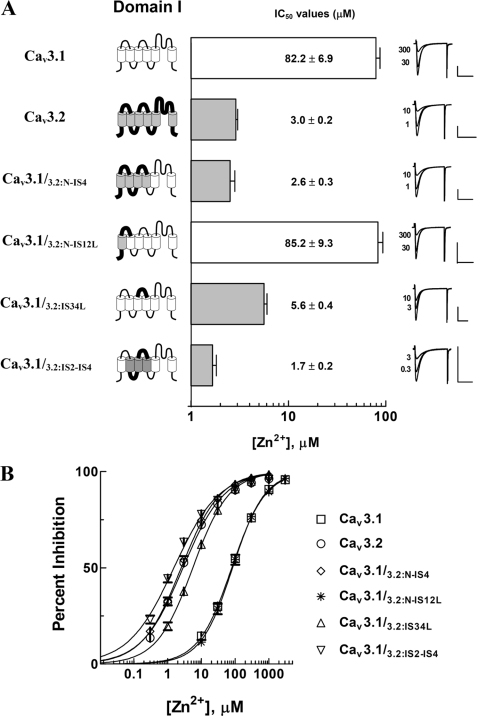
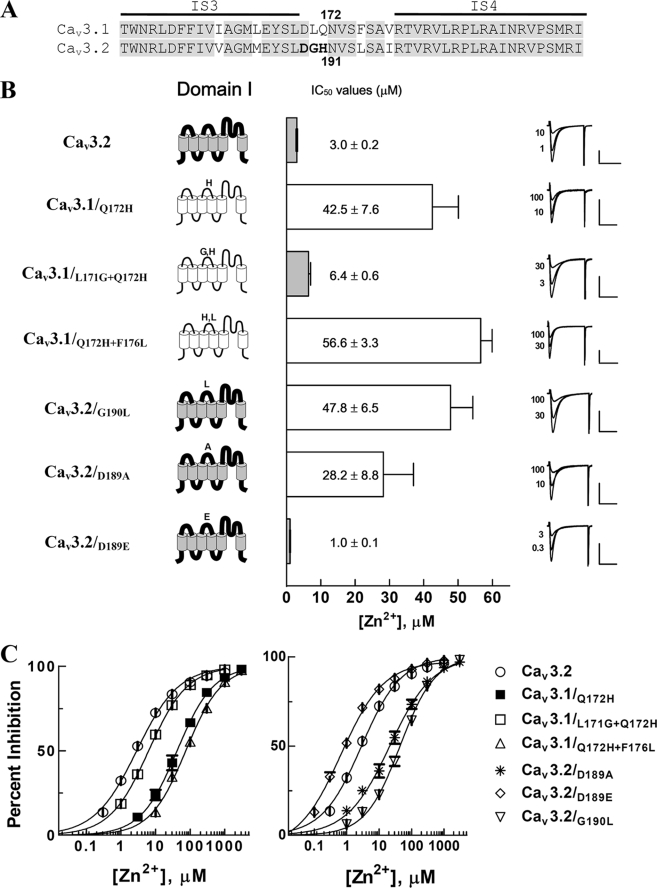
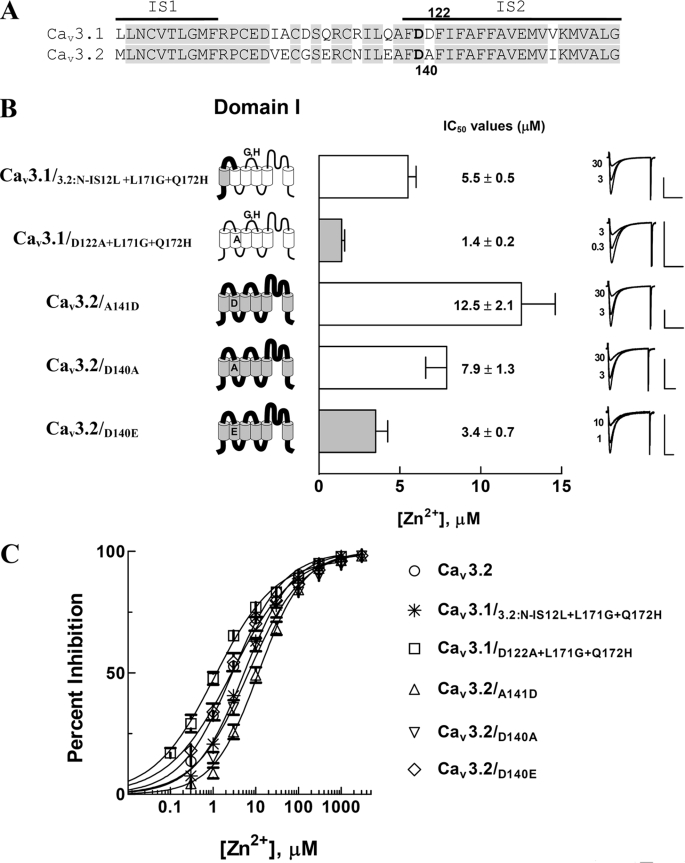
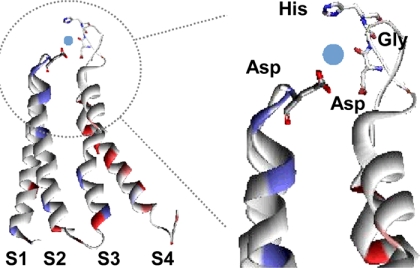
Ca(v)3.2 T-type channels contain a high affinity metal binding site for trace metals such as copper and zinc. This site is occupied at physiologically relevant concentrations of these metals, leading to decreased channel activity and pain transmission. A histidine at position 191 was recently identified as a critical determinant for both trace metal block of Ca(v)3.2 and modulation by redox agents. His(191) is found on the extracellular face of the Ca(v)3.2 channel on the IS3-S4 linker and is not conserved in other Ca(v)3 channels. Mutation of the corresponding residue in Ca(v)3.1 to histidine, Gln(172), significantly enhances trace metal inhibition, but not to the level observed in wild-type Ca(v)3.2, implying that other residues also contribute to the metal binding site. The goal of the present study is to identify these other residues using a series of chimeric channels. The key findings of the study are that the metal binding site is composed of a Asp-Gly-His motif in IS3-S4 and a second aspartate residue in IS2. These results suggest that metal binding stabilizes the closed conformation of the voltage-sensor paddle in repeat I, and thereby inhibits channel opening. These studies provide insight into the structure of T-type channels, and identify an extracellular motif that could be targeted for drug development.


Figures

FIGURE 1.
FIGURE 1.
Dose-response curves of zinc inhibition of recombinant Cav3.1, Cav3.1/Q172H, Cav3.2, and Cav3.2/H191Q expressed in Xenopus oocytes. Currents were elicited by a test potential to −20 mV from a holding potential of −90 mV every 15 s. A–D, representative current traces of Cav3.1, Cav3.2, Cav3.1/Q172H, and Cav3.2/H191Q before and after cumulative application of concentrations of zinc were superimposed. Scale bars on the x and y axes represent 20 ms and 1 μA, respectively. E, dose-response curves of zinc inhibition on Cav3.1 (□) and Cav3.1/Q172H (■). Currents were normalized to the peak current measured before application of zinc solutions, and the normalized percent inhibition was plotted against zinc concentrations. The smooth curves were obtained from fitting the average data with the Hill equation. Dose-response curves of zinc inhibition on Cav3.2 (○) and Cav3.2/H191Q (●) were obtained from analyzing data in a similar way and shown in F. All data are presented as mean ± S.E. (n = 4–42). The voltage dependence of activation and steady-state inactivation of wild-type and mutant channels are summarized in Table 1.
FIGURE 2.
FIGURE 2.
Potency of zinc to inhibit Cav3.1, Cav3.2, and chimeric channels mutated in the domain I. A, schematic diagrams of Cav3.1, Cav3.2, and their chimeras were linearly represented for Domain I (left). The transmembrane segments and connecting loops of the T-type channels are displayed with cylinders and lines. White cylinders and thin lines represent the regions from Cav3.1, whereas gray cylinders and thick lines represent regions from Cav3.2. Domains II, III, and IV of these chimeras were from Cav3.1. IC50 values of chimeric channels were exhibited with bar graphs (middle). These values were obtained from dose-response curves (shown in B) for which the percent inhibition data were fitted with the Hill equation. Representative current traces of Cav3.1, Cav3.2, and chimeric channels before and after zinc inhibition were exhibited (right panel of A). Scale bars on the x and y axes represent 40 ms and 1 μA, respectively. B, dose-response curves of Cav3.1, Cav3.2, and their chimeric channels. The chimeric channels (Cav3.1/3.2:N-IS4 (◇), Cav3.1/3.2:IS34L (▵), and Cav3.1/3.2:IS2-IS4 (▿)), which contain the linker connecting IS3 and IS4 of Cav3.2 in common, were inhibited by low micromolar concentrations of zinc. Their zinc inhibition sensitivities were close to that of Cav3.2 (○). In contrast, Cav3.1/3.2:N-IS12L (*) required much higher concentrations to be inhibited and its zinc sensitivity was similar to that of Cav3.1 (□). All data are presented as mean ± S.E. (n = 4–42).
FIGURE 3.
FIGURE 3.
Zinc inhibition profiles of the mutant channels in the IS3–IS4 linkers of Cav3 channels. A, the amino acid sequences between the linkers connecting S3 and S4 of domain I of Cav3.1 and Cav3.2 are aligned. The putative membrane-spanning segments are marked with horizontal bars above the sequence, and conserved residues between the Cav3.1 and Cav3.2 are highlighted in gray. The residues critically contributing to zinc inhibition sensitivity are represented by bold letters and amino acid numbers are based on the Cav3.1 and Cav3.2 sequence, respectively. B, the IC50 values of the Cav3.1 mutant channels (Cav3.1/Q172H, Cav3.1/L171G+Q172H, and Cav3.1/Q172H+F176L) and Cav3.2 mutant channels (Cav3.2/D189A, Cav3.2/D189E, and Cav3.2/G190L) are displayed with bar graphs. Representative current traces before and after zinc inhibition were superimposed for comparison. C, the dose-response curves of zinc inhibition for mutant channels were obtained from fitting the average inhibition percentages by different zinc concentrations with the Hill equation. The left panel showed dose-response curves of the Cav3.1 mutant channels (Cav3.1/Q172H (■), Cav3.1/L171G+Q172H (□), and Cav3.1/Q172H+F176L (▵)). The dose-response curves of the Cav3.2 mutant channels are exhibited in the right panel for Cav3.2/D189A (*), Cav3.2/D189E (◇), and Cav3.2/G190L (▿). All data are presented as mean ± S.E. (n = 4–42).
FIGURE 4.
FIGURE 4.
Zinc inhibition profiles of channels mutated in transmembrane segment IS2 of Cav3. A, alignment of the amino acid sequences between the S1 and S2 of domain I of Cav3.1 and Cav3.2 channels. The horizontal bars above the sequence represent the putative membrane-spanning segments, and the highlighted portions in gray mark conserved residues between the Cav3.1 and Cav3.2. Phe-Asp-Asp is found in the outer portion of IS2 in the Cav3.1, whereas Phe-Asp-Ala in the Cav3.2. Amino acid numbers are based on the Cav3.1 and Cav3.2, respectively. B, schematic diagrams of the mutant channels (Cav3.1/3.2:N-IS12L+L171G+Q172H, Cav3.1/D122A+L171G+Q172H, Cav3.2/A141D, Cav3.2/D140A, and Cav3.2/D140E) are shown at the left. Their IC50 values and representative current traces are in the middle and right. C, the dose-response curves of zinc inhibition on individual mutant channels were obtained from fitting the average inhibition percentages by different zinc concentrations with the Hill equation for Cav3.1/3.2:N-IS12L+L171G+Q172H (*), Cav3.1/D122A+L171G+Q172H (□), Cav3.2/A141D (▵), Cav3.2/D140A (▿), and Cav3.2/D140E (◇). All data are presented as mean ± S.E. (n = 8–14).
FIGURE 5.
FIGURE 5.
A structural model for zinc binding to the identified elements on the Cav3.2 channel. This model is modified from the structural model of a closed voltage-gated potassium channel (26). For clarity, only the voltage-sensor paddle is shown (left panel). The zinc interacting residues are shown by individual amino acids, of which oxygen, carbon, and nitrogen atoms are marked red, white, and blue, respectively. A possible location of the zinc ion is displayed with a blue sphere. Because the amino acid sequence of the IS3–IS4 linker of Cav3.2 is profoundly different from the Shaker potassium channel, we modeled the Asp-Gly-His motif to that predicted for the albumin ATCUN motif (29).
FIGURE 6.
FIGURE 6.
Zinc inhibition of ionic and gating currents of Cav3.2 expressed in HEK-293 cells. Whole cell patch recordings were made using the Hh8-5 stable cell line expressing Cav3.2 (41). Currents were measured using 10 mm Ca2+ in the external solution and 155 TEA-CI in the internal solution as charge carriers. A, ionic currents recorded during a step pulse to −20 mV from a holding potential of −100 mV. Currents were measured before (control) and after application of 10 μm ZnCl2. B, average results of the peak currents were measured in control and zinc. C, gating currents were measured from the same cell using a step depolarization to +55 mV. Each trace represents the average of 20 consecutive sweeps. As in A, data recorded in the presence of zinc is represented by a thick line. D, average gating currents were normalized to control. Control 2 is a time-matched control where cells were continuously perfused with the 10 mm external solution.

Similar articles

Cited by

References

    1. Perez-Reyes E. (2003) Physiol. Rev. 83, 117–161 - PubMed
    1. Iftinca M. C., Zamponi G. W. (2009) Trends Pharmacol. Sci. 30, 32–40 - PubMed
    1. Kozlov A. S., McKenna F., Lee J. H., Cribbs L. L., Perez-Reyes E., Feltz A., Lambert R. C. (1999) Eur. J. Neurosci. 11, 4149–4158 - PubMed
    1. Chemin J., Monteil A., Perez-Reyes E., Bourinet E., Nargeot J., Lory P. (2002) J. Physiol. 540, 3–14 - PMC - PubMed
    1. Ellinor P. T., Yang J., Sather W. A., Zhang J. F., Tsien R. W. (1995) Neuron 15, 1121–1132 - PubMed

Publication types

LinkOut - more resources