. 2010 Feb 5;285(6):3664-3675.
doi: 10.1074/jbc.M109.039974. Epub 2009 Nov 23.

Direct observation of individual KCNQ1 potassium channels reveals their distinctive diffusive behavior

Affiliations

Direct observation of individual KCNQ1 potassium channels reveals their distinctive diffusive behavior

Gregory I Mashanov et al. J Biol Chem. .

Abstract

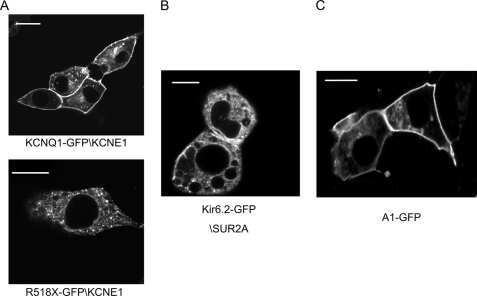
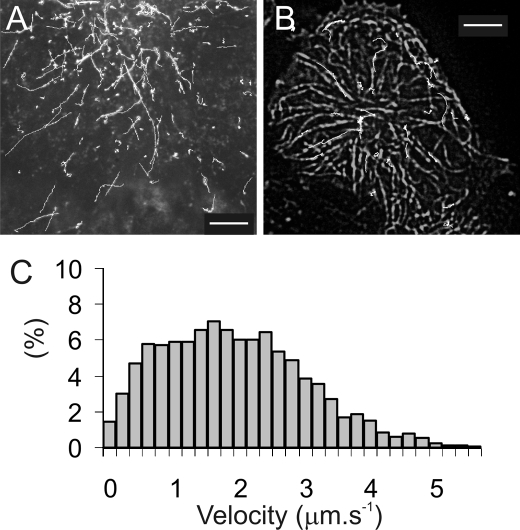
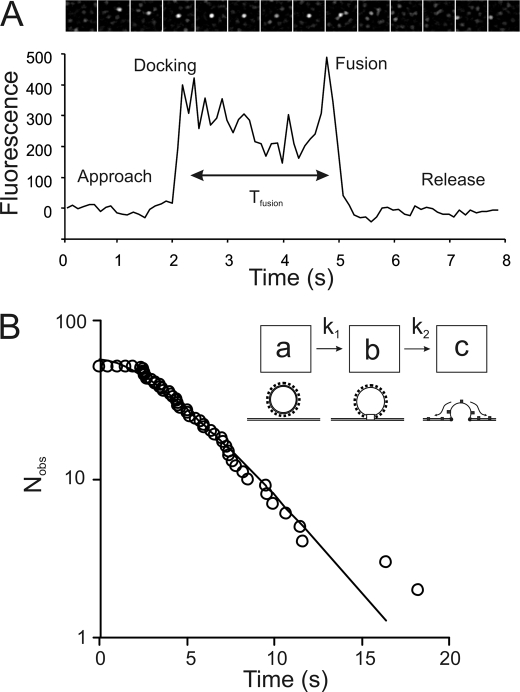
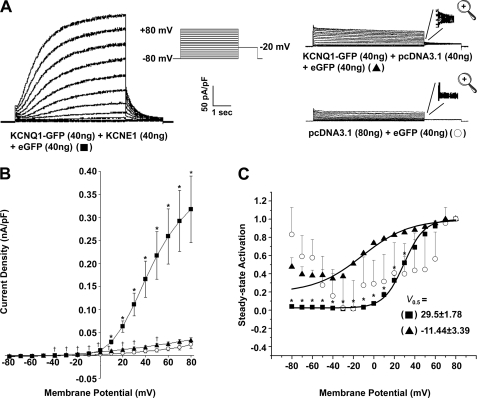
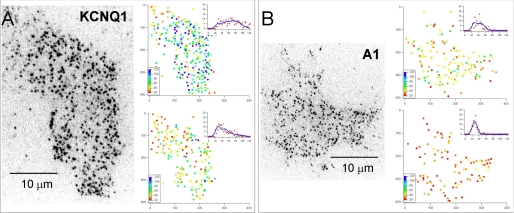
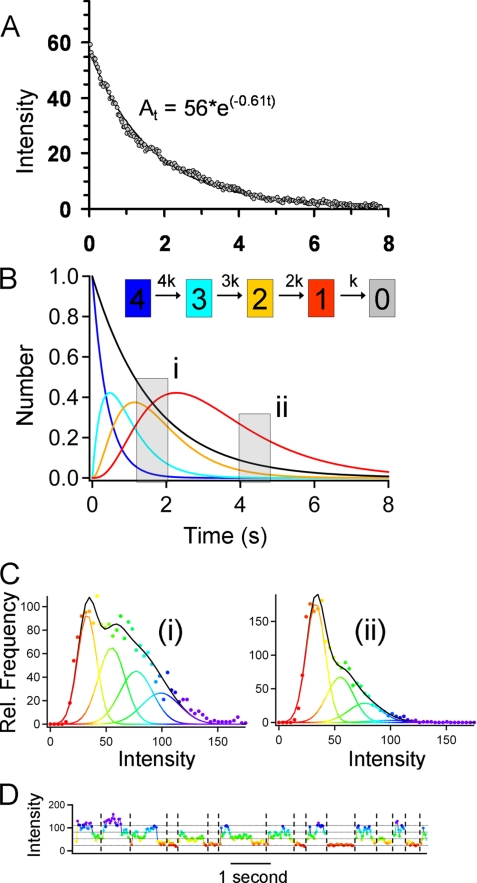
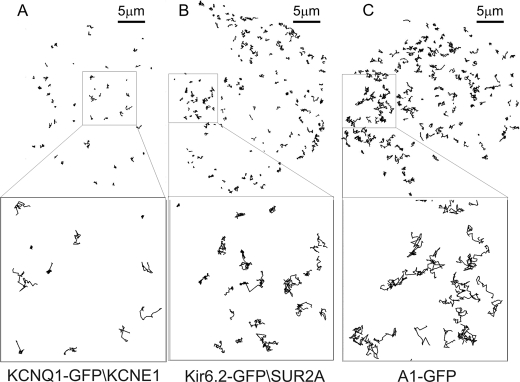
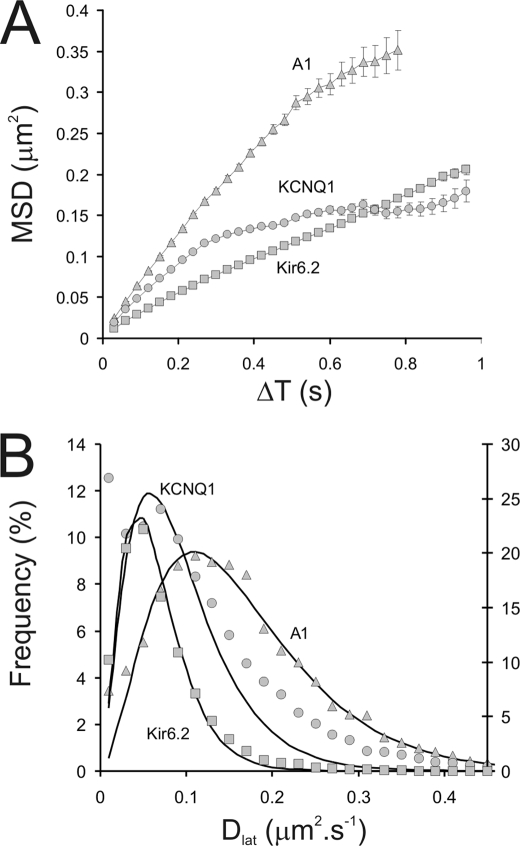
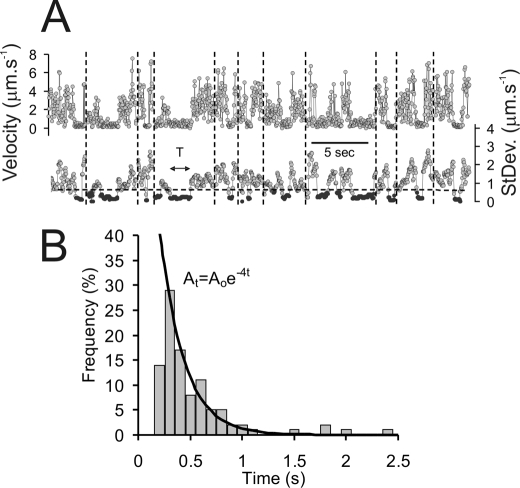
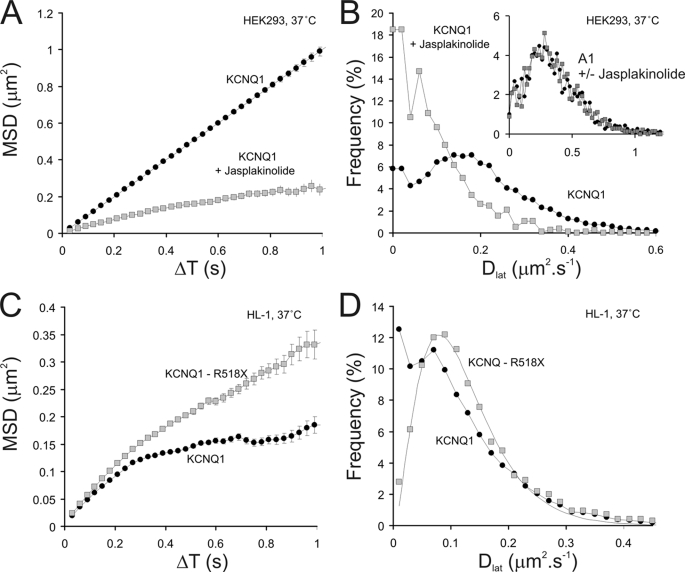
We have directly observed the trafficking and fusion of ion channel containing vesicles and monitored the release of individual ion channels at the plasma membrane of live mammalian cells using total internal reflection fluorescence microscopy. Proteins were fused in-frame with green or red fluorescent proteins and expressed at low level in HL-1 and HEK293 cells. Dual color imaging revealed that vesicle trafficking involved motorized movement along microtubules followed by stalling, fusion, and subsequent release of individual ion channels at the plasma membrane. We found that KCNQ1-KCNE1 complexes were released in batches of about 5 molecules per vesicle. To elucidate the properties of ion channel complexes at the cell membrane we tracked the movement of individual molecules and compared the diffusive behavior of two types of potassium channel complex (KCNQ1-KCNE1 and Kir6.2-SUR2A) to that of a G-protein coupled receptor, the A1 adenosine receptor. Plots of mean squared displacement against time intervals showed that mobility depended on channel type, cell type, and temperature. Analysis of the mobility of wild type KCNQ1-KCNE1 complexes showed the existence of a significant immobile subpopulation and also a significant number of molecules that demonstrated periodic stalling of diffusive movements. This behavior was enhanced in cells treated with jasplakinolide and was abrogated in a C-terminal truncated form (KCNQ1(R518X)-KCNE1) of the protein. This mutant has been identified in patients with the long QT syndrome. We propose that KCNQ1-KCNE1 complexes interact intermittently with the actin cytoskeleton via the C-terminal region and this interaction may have a functional role.


Figures

FIGURE 1.
FIGURE 1.
Imaging with confocal microscopy in live HL-1 cells. A (upper), KCNQ1-GFP-KCNE1 localizes to the plasma membrane and (lower) the mutant KCNQ1(R518X)-GFP-KCNE1 shows diffuse punctate localization and weak localization to the plasma membrane. B, Kir6.2-GFP-SUR2A localizes partially to the cytoplasm. C, A1-GFP localizes to the plasma membrane. Scale bars are 10 μm.
FIGURE 2.
FIGURE 2.
The delivery of KCNQ1-GFP containing vesicles to the plasma membrane of HEK-293 cells visualized by TIRFM at 37 °C. A, shows trajectories (white lines) of KCNQ1-GFP containing vesicles moving within HL1 cells. The initial frame in the video sequence is shown overlaid and illustrates how the low background imaging provided by TIRM allows individual vesicles to be tracked as they move toward the cell periphery. B, dual color TIRF imaging of HL-1 cells co-transfected with KCNQ1-GFP-KCNE1 and mRFP-tubulin shows that vesicle tracks (white lines) follow closely the path of microtubules shown as the overlaid image. Scale bars are 5 μm. C, a histogram showing the distribution of velocities measured for the vesicles tracked above indicates a mean velocity of 1.8 μm s−1.
FIGURE 3.
FIGURE 3.
A, the characteristic time course of KCNQ1-GFP-KCNE1 vesicle fusion consisting of approach, docking, fusion, and then release of ion channels from an individual vesicle. Fluorescence intensity at the fusion zone (0.5 × 0.5 μm2 region) is plotted against time. The panel of images above shows a film strip of an area (3.5 × 3.5 μm2) around the fusion site. The images are aligned roughly to correspond to the intensity versus time plot below. The graph shows how intensity rises abruptly when the vesicle arrives at the fusion site (“docking” at t = 2 s), declines slightly due to photobleaching and rises again shortly before ion channel release (“fusion” at t = 5 s). TIRFM imaging of HEK-293 cells were recorded at 37 °C. B, to investigate the kinetics of the fusion process, the distribution of “docked” vesicle lifetimes (time, Tfusion, in panel A) were plotted as a cumulative frequency plot (i.e. number of intact vesicles remaining after each time interval) against time. The lifetimes do not fit to a single exponential process but instead fit moderately well to a two-step kinetic process. The kinetic scheme (inset) shows how two sequential processes might be required for the docking and fusion process (schematic). The least squares fitted line is given by the solution to such a two-step sequential scheme. The fitted line here and elsewhere in the paper was obtained by iterative, least squares error minimization based on a generalized reduced gradient method (using the ExcelTM, “Solver” option). The goodness to fit (given by χ2 value) is better than 95% here and for all other fitted lines except where indicated otherwise. The functional form of the fitted line is of a two-step, sequential, biochemical process: At= A0 (e−k1t + ((k1)/(k2k1) ek1t − (k1)/(k2k1) ek2t), where A0 = 57; k1 = 0.33 s−1; k2 = 0.34 s−1.
FIGURE 4.
FIGURE 4.
Patch clamp characterization of low-level expression of KCNQ1-GFP and KCNE1 in HEK293 cells. A, representative traces of currents produced by HEK293 cells that are transfected with KCNQ1-GFP (40 ng) and KCNE1 (40 ng), KCNQ1-GFP (40 ng) and pcDNA3.1 (40 ng), or pcDNA3.1 alone (80 ng). To identify transfected cells eGFP (40 ng) was co-transfected and the transfected cells identified by epifluorescence. The currents displayed are normalized to cell capacitance. The voltage protocol used is shown in the inset. B, maximal current density normalized to cell capacitance (nA/pF). * indicates a significant difference (p < 0.05) between the current density values for KCNQ1-GFP (40 ng) + KCNE1 (40 ng) + eGFP (40 ng) compared with those for KCNQ1-GFP (40 ng) + pcDNA3.1 (40 ng) + eGFP (40 ng). † indicates a significant difference (p < 0.05) between the current density values for KCNQ1-GFP (40 ng) + pcDNA3.1 (40 ng) + eGFP (40 ng) compared with those for pcDNA3.1 (80 ng) + eGFP (40 ng). C, normalized voltage-dependent activation curves of KCNQ1-GFP (40 ng) expressed with or without KCNE1 (40 ng). The activation curves are fitted with Boltzmann functions (y = [1 + exp(V0.5V)/(slope factor)]−1, solid lines) using non-linear regression. For KCNQ1-GFP (40 ng) + KCNE1 (40 ng), V0.5 = 29.5 ± 1.8 mV and slope factor = 9.86 ± 0.93 mV. For KCNQ1-GFP (40 ng) alone, V0.5 = −11.44 ± 3.39 mV and slope factor = 23.0 ± 2.28 mV. The residual steady-state activation with KCNQ1-GFP hyperpolarized potentials reflects endogenous current expression. Despite this the relationship is obviously rightward shifted with coexpression of KCNE1. Data are presented as mean ± S.E. (n = 5). The V0.5 values shown in C are significantly different (p < 0.05) from each other. * indicates a significant difference (p < 0.05) between the steady-state activation values for KCNQ1-GFP (40 ng) + KCNE1 (40 ng) + eGFP (40 ng) compared with those for KCNQ1-GFP (40 ng) + pcDNA3.1 (40 ng) + eGFP (40 ng).
FIGURE 5.
FIGURE 5.
Individual molecular complexes were visualized using TIRF microscopy. A and B, left-hand panels show single video frames captured at the start of experiments in which KCNQ1-GFP and A1-GFP adenosine receptors were imaged using TIRFM. The images are displayed using an inverted grayscale lookup table so that individual fluorescent spots appear black on a white background. The two panels on the right of each figure show individual spots as a color-coded dot plot that represents the mean pixel intensity, integrated over a 5 × 5 pixel region. A histogram of the spot intensities and a least-squares fit to the sum of four Gaussian curves (see Fig. 6 for description) is show as an inset graph. The upper panels are data obtained at the start of the recording period and the lower panels are data collected toward the end of the recording (about 3 s later). The entire video sequence, the corresponding dot-plot representations, and intensity histograms are shown animated in supplemental Movies 7–10.
FIGURE 6.
FIGURE 6.
Analysis of the spot intensities reveals that KCNQ1-GFP-KCNE1 exists as a homotetramer. A, the bulk photobleaching rate was determined experimentally by measuring the summed intensity over the entire cell area over time. The photobleaching rate shown here (0.6 s−1) is typical for all our experiments. B, sequential photobleaching of a tetrameric molecule with four GFP tags can be modeled as an irreversible, 4-step process; this is shown in the kinetic scheme. The evolution of differently labeled species (4 →3 → 2 → 1 → 0) over time was modeled by the numerical solution of the differential equations (using a Runge-Kutta approximation in IgorProTM, Wavemetrics, Lake Oswego, OR). The intensity of an individual GFP fluorophore was determined from immobilized monomeric GFP in control specimens (5 × 5 pixel area gave an average of 20 counts/pixel/image frame). The intensity distribution measured for a population of individual spots over time can be modeled as the sum of four Gaussian terms, corresponding to complexes with 4, 3, 2, and 1 labels. C, the experimentally observed distributions measured over the time periods shown in gray (labeled i and ii) are plotted for an experiment with KCNQ1. D, when the intensity of individual spots is plotted against time we find that there is a complicated pattern of behaviors. Some spots show multistep sequential photobleaching. On the chosen color scale they change from blue to green to yellow to red and then disappear. However, many spots show sudden drops and rises in intensity consistent with GFP blinking or because spots merge and then move apart again on the video images. See supplemental Movies 7–10. By definition, at the end of each track the intensity falls to zero (the background level). The plotted line is color-coded identically to Fig. 5 so as to emphasize transitions between different intensity levels and shows that the chosen color lookup table corresponds closely to the discrete intensity levels.
FIGURE 7.
FIGURE 7.
Imaging of single ion channels using TIRFM in live HL1 cells at 37 °C (see supplemental movies) allows individual molecular trajectories to be followed in space and time. Custom image analysis software analyses the tracks of individual, diffraction limited spots corresponding to the location of each molecule. The diagrams show tracks determined for different proteins over a 15-s interval. A, trajectories of individual KCNQ1-GFP-KCNE1 ion channels is shown with the inset below showing a zoomed area. B, Kir6.2-GFP-SUR2A, lower inset shows the zoomed area. C, A1-GFP, lower inset shows the zoomed area.
FIGURE 8.
FIGURE 8.
Graphs describing the diffusive motion of KCNQ1-GFP-KCNE1, Kir6.2-GFP-SUR2A, and A1-GFP at the plasma membrane of HL-1 cells measured at 37 °C using TIRFM. A, plots of the averaged MSD versus ΔT are shown for KCNQ1-GFP-KCNE1 (○) and Kir6.2-GFP-SUR2A (□) and A1 receptors (Δ). Note the deviation from linearity found for KCNQ1 at time intervals above 0.2 s. B, distribution of estimates of Dlat for the population of molecules studied shown as a histogram (symbols as for panel A). The solid lines are least-squares fits to a γ probability density function. Where y =(1)/(baÃ(a))xa−1 · e(−x)/(b), in which b determines scale and a shape (note: Γ(a) is the γ function of a). Note that the function fits the data for A1-GFP and Kir6.2-GFP (χ2 ≫ 95%) but is a very poor fit to the data obtained for KCNQ1-GFP (χ2 ∼ 0%) (the data are summarized in Table 1). The right y axis refers to the Dlat distribution for Kir6.2-GFP-SUR2A.
FIGURE 9.
FIGURE 9.
Analysis of the diffusion of KCNQ1 channels (in HEK293 cells, 37 °C) indicates a transient, stop-start, behavior. A, velocity and variance of molecular displacements are plotted against time for 11 molecules concatenated into a single data series. The vertical dotted lines indicate where data for each molecule starts and ends. The horizontal dotted line indicates the variance threshold used to discriminate periods of paused movement. B, histogram showing the distribution of the lifetimes of paused intervals. The solid black line is a least-squares fit to a single exponential, At = Aoert, where r = 4 s−1.
FIGURE 10.
FIGURE 10.
The effect of jasplakinolide treatment on the mobility of KCNQ1-GFP-KCNE1 ion channels and the effect of artificially truncating the molecule (mutant R518X) to remove its C-terminal protein kinase A anchoring protein domain. A, plot of MSD versus ΔT for KCNQ1-GFP-KCNE1 (○) in HEK293 cells is fairly linear over the full range of the plot. Following treatment with 3 μm jasplakinolide (□) for 40 min mobility is reduced and restricted (or anomalous) diffusion occurs at times greater than 0.4 s. B, histograms showing the distributions of Dlat for the above data (panel A) reveals that the anomalous behavior seen after jasplakinolide treatment is due to a significant population of slow moving molecules (peak near to zero Dlat). The lines between data points simply connect them to aid visualization. An analogous experiment performed with A1-GFP shows that the addition of 3 μm jasplakinolide (filled squares show after treatment) for 40 min did not affect mobility (inset). The x and y axis labels for the inset are the same as for the main figure. C, mobility of wild type KCNQ1-GFP (○) was compared with that of a C-terminal truncated mutant (R518X) (□) (HL1 cells, 37 °C), the mutant was more mobile and the plot more linear than the parent, wild type molecule. The lines between data points simply connect them to aid visualization. The control KCNQ1-GFP-KCNE1 data are the same as that shown in Fig. 6. D, histograms showing the distribution of Dlat show that the mutant (KCNQ-R518X) data fits well to a simple γ function (see Fig. 5B, legend), whereas the wild type data does not fit to the function (the lines drawn simply connect the data points to aid visualization) and reveals a significant (13% of the data) slow-moving or immobile subpopulation (total trajectories analyzed; 12,198). The control KCNQ1-GFP-KCNE1 data are the same as that shown in Fig. 6.

Similar articles

Cited by

References

    1. Salkoff L., Jegla T. (1995) Neuron 15, 489–492 - PubMed
    1. Barhanin J., Lesage F., Guillemare E., Fink M., Lazdunski M., Romey G. (1996) Nature 384, 78–80 - PubMed
    1. Sanguinetti M. C., Curran M. E., Zou A., Shen J., Spector P. S., Atkinson D. L., Keating M. T. (1996) Nature 384, 80–83 - PubMed
    1. Chen H., Kim L. A., Rajan S., Xu S., Goldstein S. A. (2003) Neuron 40, 15–23 - PubMed
    1. Priori S. G., Barhanin J., Hauer R. N., Haverkamp W., Jongsma H. J., Kleber A. G., McKenna W. J., Roden D. M., Rudy Y., Schwartz K., Schwartz P. J., Towbin J. A., Wilde A. M. (1999) Circulation 99, 518–528 - PubMed

Publication types

MeSH terms

LinkOut - more resources