. 2009 Nov 25;29(47):14687-700.
doi: 10.1523/JNEUROSCI.1160-09.2009.

Synaptic activity induces dramatic changes in the geometry of the cell nucleus: interplay between nuclear structure, histone H3 phosphorylation, and nuclear calcium signaling

Affiliations

Synaptic activity induces dramatic changes in the geometry of the cell nucleus: interplay between nuclear structure, histone H3 phosphorylation, and nuclear calcium signaling

Malte Wittmann et al. J Neurosci. .

Abstract

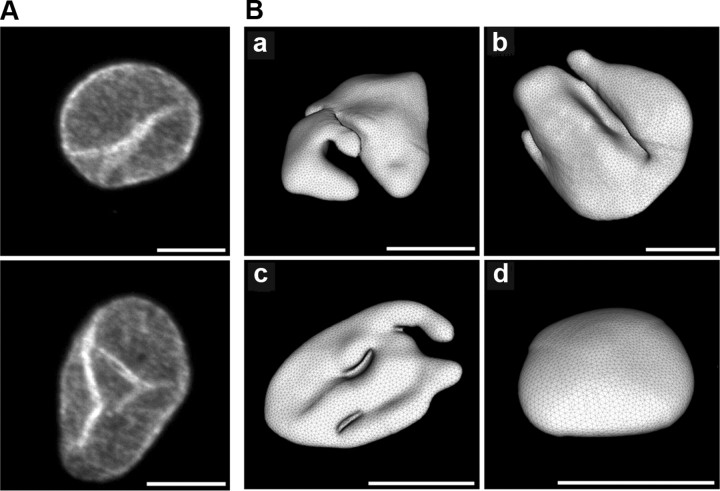
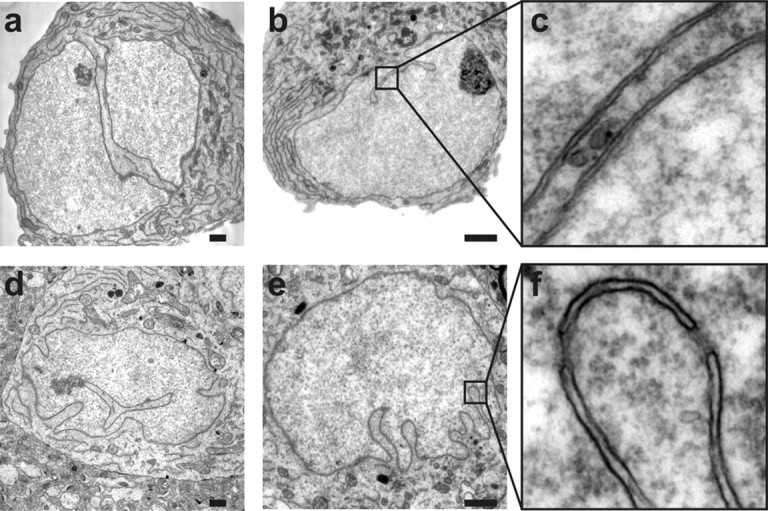
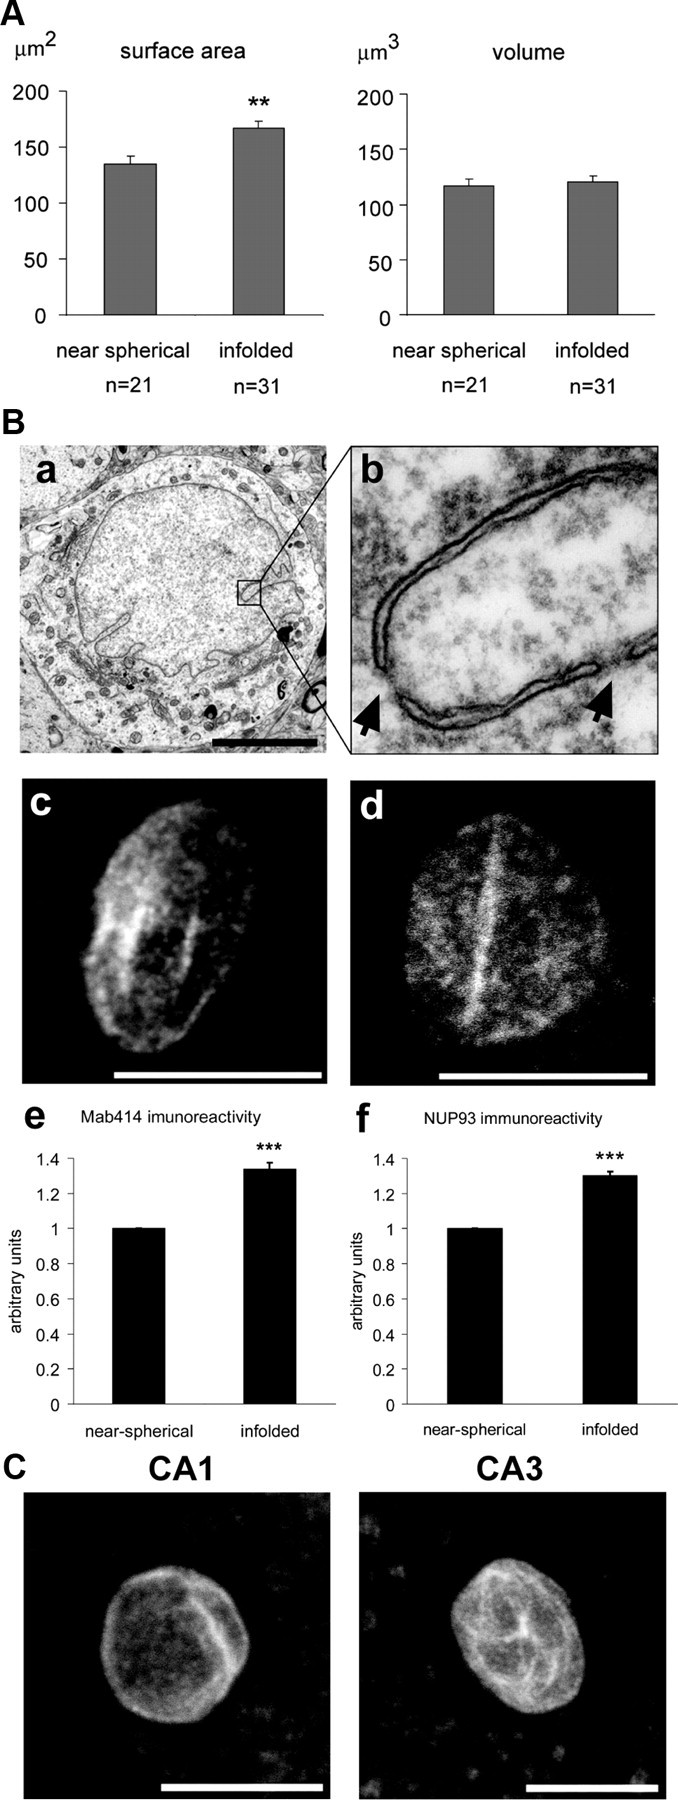
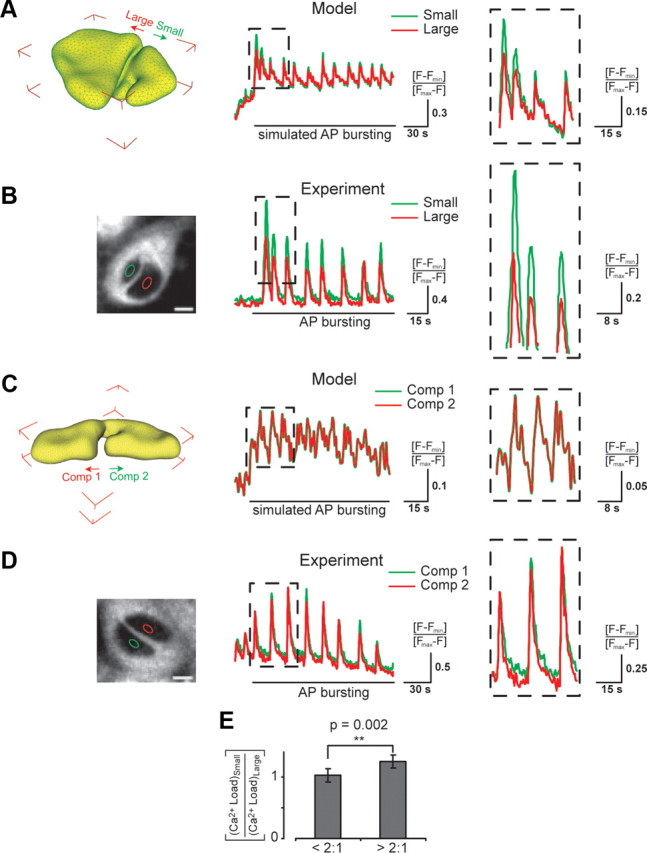
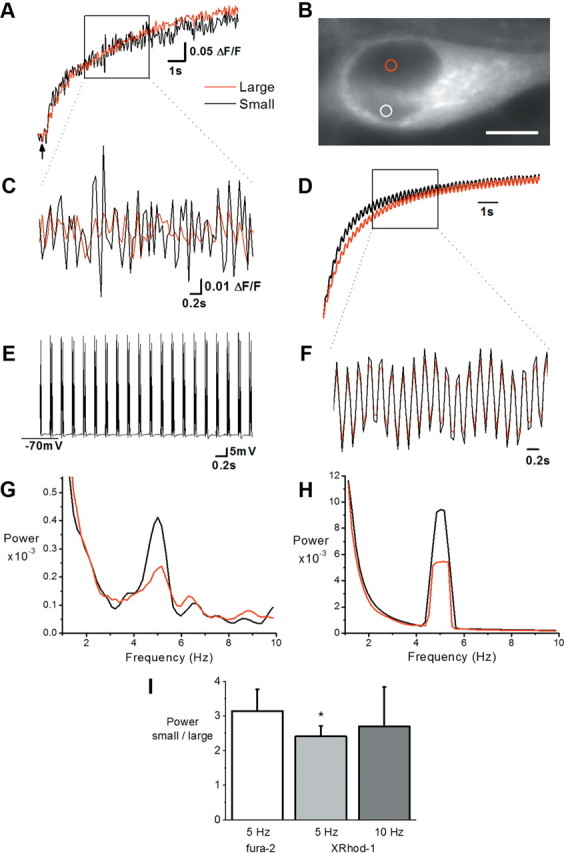
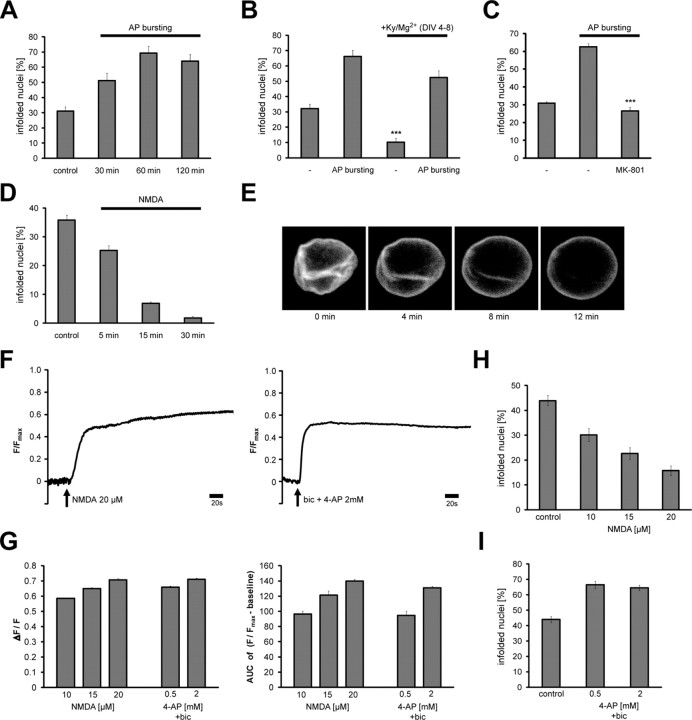
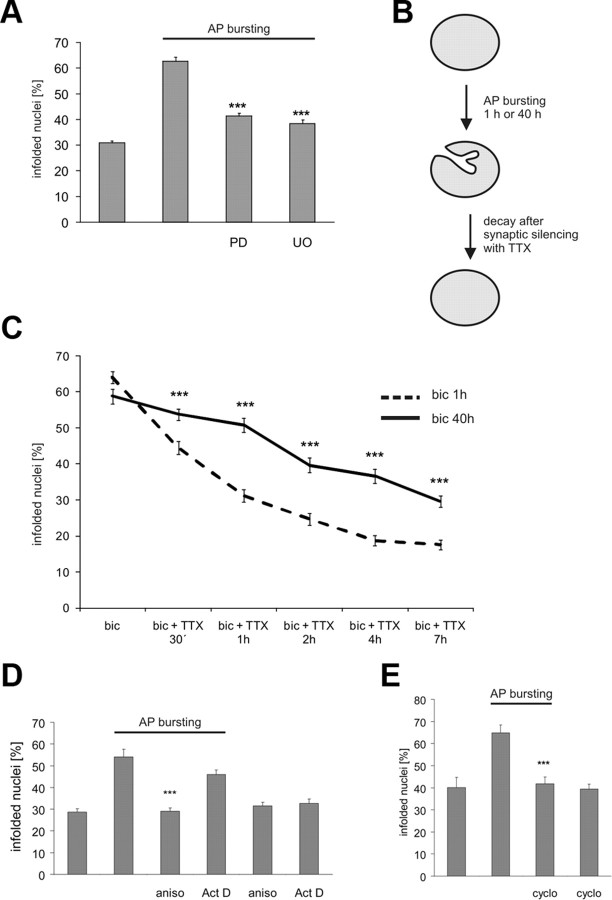
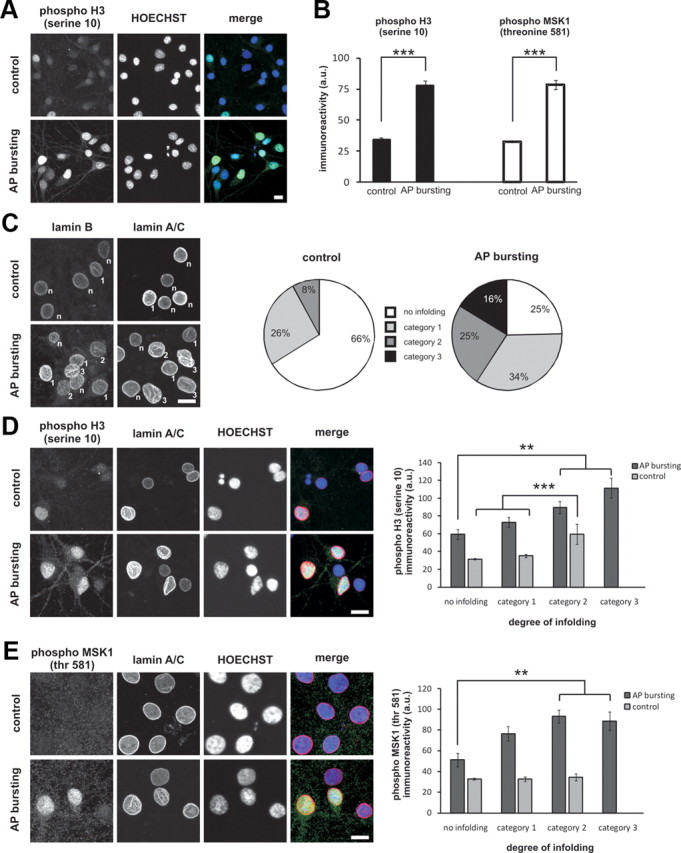
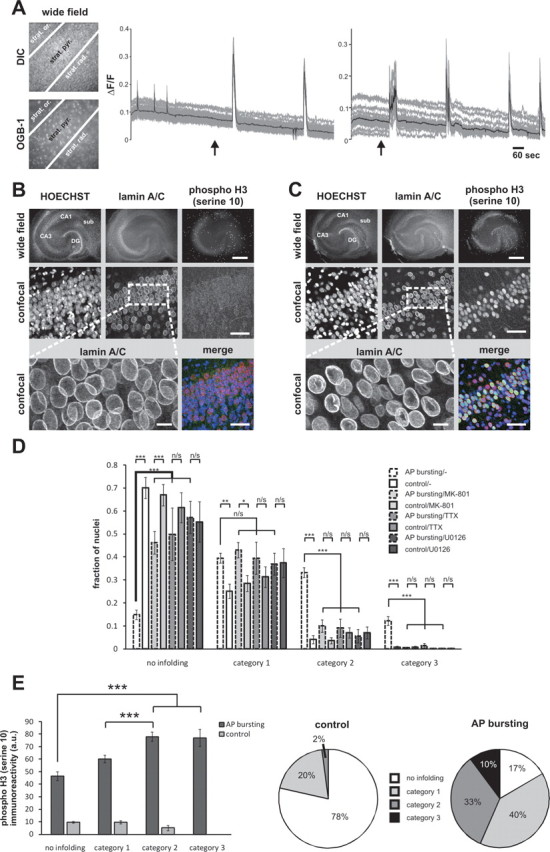
Synaptic activity initiates many adaptive responses in neurons. Here we report a novel form of structural plasticity in dissociated hippocampal cultures and slice preparations. Using a recently developed algorithm for three-dimensional image reconstruction and quantitative measurements of cell organelles, we found that many nuclei from hippocampal neurons are highly infolded and form unequally sized nuclear compartments. Nuclear infoldings are dynamic structures, which can radically transform the geometry of the nucleus in response to neuronal activity. Action potential bursting causing synaptic NMDA receptor activation dramatically increases the number of infolded nuclei via a process that requires the ERK-MAP kinase pathway and new protein synthesis. In contrast, death-signaling pathways triggered by extrasynaptic NMDA receptors cause a rapid loss of nuclear infoldings. Compared with near-spherical nuclei, infolded nuclei have a larger surface and increased nuclear pore complex immunoreactivity. Nuclear calcium signals evoked by cytosolic calcium transients are larger in small nuclear compartments than in the large compartments of the same nucleus; moreover, small compartments are more efficient in temporally resolving calcium signals induced by trains of action potentials in the theta frequency range (5 Hz). Synaptic activity-induced phosphorylation of histone H3 on serine 10 was more robust in neurons with infolded nuclei compared with neurons with near-spherical nuclei, suggesting a functional link between nuclear geometry and transcriptional regulation. The translation of synaptic activity-induced signaling events into changes in nuclear geometry facilitates the relay of calcium signals to the nucleus, may lead to the formation of nuclear signaling microdomains, and could enhance signal-regulated transcription.


Figures

Figure 1.
Figure 1.
Images of nuclei from hippocampal neurons. A, Projections from confocal stacks of nuclei from cultured hippocampal neurons immunostained with monoclonal antibodies to lamin B. Examples of two infolded nuclei are shown. Scale bars, 5 μm. B, Three-dimensional image reconstructions using confocal microscopy stacks of nuclei from cultured hippocampal neurons. Examples of 3 different infolded nuclei (a–c) and 1 near-spherical nucleus (d) are shown. Scale bars correspond to 5 μm of the z-projections of the images.
Figure 2.
Figure 2.
Electron micrographs of infolded nuclei from cultured hippocampal neurons (a–c) and from neurons from the CA1 pyramidal cell layer of rat hippocampal slices (d–f). The close-ups in c and f show that the invaginations are lined by both the inner and outer nuclear membranes. Scale bars, 1 μm.
Figure 3.
Figure 3.
Infolded nuclei have a larger surface and more nuclear pore complexes than near-spherical nuclei. A, Analysis of the surface (left panel) and volume (right panel) of 3D reconstructed near-spherical and infolded nuclei. Statistically significant differences (two-tailed independent samples t test) are indicated with asterisks (**p < 0.005). Error bars indicate SEM. B, Electron micrograph of an infolded nucleus from the CA1 pyramidal cell layer of the rat hippocampus (a) and close-up (b) of a nuclear infolding containing nuclear pore complexes indicated by arrows. Scale bar, 5 μm. Examples of projections from confocal stacks showing NPC immunoreactivity in cultured hippocampal neurons obtained with Mab414 (c) and anti-NUP93 (d) monoclonal antibodies; scale bars, 10 μm. Quantitative analysis of the NPC immunoreactivity obtained with Mab414 (e) and anti-NUP93 (f) monoclonal antibodies in near-spherical and infolded nuclei. The results from 4 independent experiments are shown (total number of nuclei analyzed, n = 579). Statistically significant differences (2-tailed independent samples t test) are indicated with asterisks (***p < 0.001). Error bars indicate SEM. C, NPC immunoreactivity obtained with Mab414 in nuclei from neurons from the CA1 and the CA3 pyramidal cell layer of rat hippocampal slices. Scale bars, 10 μm.
Figure 4.
Figure 4.
Dynamics of nuclear calcium signaling in differently sized and nearly equally sized compartments of infolded nuclei. For calcium imaging experiments, cultured hippocampal neurons were exposed to the GABAA receptor blocker bicuculline (50 μm); this treatment leads to bursts of AP firing and generates periodic calcium transients in the cytosol and in the nucleus (Hardingham et al., 2001a; Arnold et al., 2005). Image acquisition was done at a rate of 1.5 Hz with a confocal microscope. Calcium signals were measured using Fluo-4 at a cross-section approximately in the middle of both nuclear compartments as shown in the left panels of B and D. The dashed boxes (in A–D) show an expanded view of 3–4 peaks of the oscillating calcium signals. Details of the mathematical modeling are described in the supplemental material, available at www.jneurosci.org. A, Image of a 3D reconstructed nucleus with a large and a small compartment (left panel) that was used for mathematical modeling of calcium loads (right panel). Modeled time courses of the nuclear calcium load in the small (green trace) and the large compartment (red trace) in response to an experimentally measured cytosolic calcium transient (CCT). B, Photomicrograph of an ER-Tracker labeled cultured hippocampal neuron (left panel) illustrating the two differently sized nuclear compartments. Nuclear calcium measurements (right panel) were made in the nuclear regions of interest (ROIs) indicated by the green and the red ellipse. Scale bar, 5 μm. Time courses of periodic nuclear calcium transients measured in the small (green trace) and the large compartment (red trace) of the infolded nucleus shown in the left panel. The area of the large compartment was 3.4-fold bigger than that of the small compartment. C, Image of a 3D reconstructed nucleus with two nearly equally sized compartments (left panel) that was used for mathematical modeling of calcium loads (right panel). Modeled time courses of the nuclear calcium load in compartment 1 (Comp 1, green trace) and compartment 2 (Comp 2, red trace) in response to an experimentally measured CCT. D, Photomicrograph of an ER-Tracker labeled cultured hippocampal neuron (left panel) with two nearly equally sized nuclear compartments. Nuclear calcium measurements (right panel) were made in the nuclear ROIs indicated by the green and the red ellipse. Scale bar, 5 μm. Time courses of periodic nuclear calcium transients measured in compartment 1 (Comp 1, green trace) and compartment 2 (Comp 2, red trace) of the infolded nucleus shown in the left panel. The ratio of the areas of the two compartments was 1:1.1. E, Summary of the ratios of the calcium load measured in the small and the large compartments. To determine calcium load, calcium imaging traces were integrated over a period of 60 s of bicuculline treatment. The calcium load ratios (small/large compartment) were pooled into groups of compartment size ratios (large/small) <2:1 and >2:1. Error bars represent means ± SEM (3 independent experiments: <2:1 (n, 17 cells); >2:1 (n, 26 cells). Statistical comparisons were made using the independent one-tailed Student's t test.
Figure 5.
Figure 5.
Frequency information in calcium signals is preserved better by smaller nuclear compartments. A, B, X-Rhod-1 calcium signals measured at 21 Hz from small equally sized regions of interest in the center of the small and large nuclear compartments of a cultured hippocampal neuron labeled with ER-Tracker blue-white DPX shown in B. Calcium levels rise in response to bursting which began at the point indicated by the arrow. Heterogeneous compartment size was apparent at all focal planes. Scale bar, 5 μm. C, Calcium signals (high-pass filtered at 1 Hz) over the period indicated in A. D, A simulated calcium signal in a small and a large nuclear compartment of a model nucleus was generated as a response to a hypothetical signal input. This input was created from a second order exponential fit to the somatic response of the real neuron in A, with a superimposed oscillation at 5 Hz. The simulated calcium signal was calculated considering the total volume of each compartment. E, The membrane potential shows 5 Hz bursting recorded in parallel with the calcium signal over the same time period as in C. Bursting was induced with current injection applied via whole-cell patch clamp in 5 Hz bursts (1 burst = 5 injections at 100 Hz). F, Calcium signals (high-pass filtered at 1 Hz) from the model nucleus over the period indicated in D. G, H, Power spectral density plots computed by the multitaper method (FFT size, 128, 5 data tapers). A clear peak is apparent around 5 Hz in the calcium signals of all compartments in both the real neuron (G) and the model nucleus (H). Note the larger amplitude of this peak in the smaller compartments in both real and model nucleus. Sampling frequency and analysis parameters of modeling and experimental data are identical. I, Summary histogram showing the normalized power peak in small relative to large compartments in response to bursting at 5 Hz and 10 Hz using X-Rhod-1 (5 Hz: n = 9, 10 Hz: n = 5) or fura-2 (5 Hz: n = 8). *p < 0.05 paired Student's t test.
Figure 6.
Figure 6.
Control of nuclear geometry by synaptic and extrasynaptic NMDA receptors. A, Analysis of the percentage of infolded nuclei in cultured hippocampal neurons following bicuculline (50 μm) induced AP bursting for the indicated times. B, Analysis of the percentage of infolded nuclei in hippocampal neurons grown between day in vitro (DIV) 4 and 8 in the absence or presence of 1 mm kynurenate and 11 mm MgCl2 (KyMg2+); this treatment blocks glutamatergic synaptic transmission and NMDA receptors. AP bursting was induced with bicuculline (50 μm) for 1 h on DIV 11. Statistically significant differences (two-tailed independent samples t test) are indicated with asterisks (***p < 0.001). Error bars indicate SEM. C, Analysis of the percentage of infolded nuclei in cultured hippocampal neurons following bicuculline (50 μm) induced AP bursting for 1 h in the absence or presence of MK-801 (20 μm). MK-801 was added 5 min before stimulation. Statistically significant differences (two-tailed independent samples t test) are indicated with asterisks (***p < 0.001). Error bars indicate SEM. D, Analysis of the percentage of infolded nuclei in cultured hippocampal neurons after bath application of NMDA (50 μm) for the indicated times. Such treatment of hippocampal neurons with NMDA triggers pathways leading to cell death through the activation of extrasynaptic NMDA receptors (Hardingham et al., 2002). The stimulation of cell death pathways by treatment of cultured hippocampal neurons for 1 or 2 h with 100 nm staurosporine had no effect on the percentage of infolded nuclei (data not shown). E, Lamin B-GFP images (z projections from confocal stacks) of a nucleus from a cultured hippocampal neuron (transfected with a lamin B-GFP expression vector) taken before and after the indicated periods of bath application of NMDA (50 μm). In the example shown, the infoldings of the nucleus disappeared within 12 min of NMDA application. F, Calcium imaging of cultured hippocampal neurons following treatment with NMDA (20 μm, left panel) or bicuculline (bic; 50 μm) plus 4-aminopyridine (4-AP; 2 mm) (right panel). The arrows indicate the time point of stimulation. Imaging traces representing average signals obtained from 48 (bic/4-AP) and 46 (NMDA) neurons are shown. G, Summary of calcium imaging experiments in cultured hippocampal neurons. Calcium response amplitudes normalized to Fmax and their integral over a 10 min response period (AUC, area under the curve) to the indicated treatments are shown. Number of cells analyzed was 1702. H, I, Analysis of the percentage of infolded nuclei in cultured hippocampal neurons before (control) and 1 h after bath application of the indicated concentration of NMDA (H) or 1 h after application of bicuculline (bic; 50 μm) and the indicated concentrations of 4-aminopyridine (4-AP) (I).
Figure 7.
Figure 7.
AP bursting-induced formation of infolded nuclei requires MAP kinase signaling and protein synthesis. A, Analysis of the percentage of infolded nuclei in cultured hippocampal neurons following bicuculline (50 μm) induced AP bursting for 1 h in the absence or presence of PD98059 (PD; 50 μm) or UO126 (UO; 10 μm). PD98059 and UO126 were added 30 min before stimulation. The percentage of infolded nuclei in unstimulated hippocampal neurons was not affected by the pretreatment with PD98059 or UO126 (data not shown). Statistically significant differences (two-tailed independent samples t test) are indicated with asterisks (***p < 0.001). Error bars indicate SEM. B, Schematic representation of the experiment in C) to determine the stability of newly formed nuclear infoldings. C, Analysis of the percentage of infolded nuclei in cultured hippocampal neurons following treatment with 1 μm tetrodotoxin (TTX) to block electrical activity. Infoldings were induced by a 1 h or a 40 h period of bicuculline (bic; 50 μm)-induced AP bursting before TTX treatment. Statistically significant differences (two-tailed independent samples t test) are indicated with asterisks (***p < 0.001). Error bars indicate SEM. D, E, Analysis of the percentage of infolded nuclei in cultured hippocampal neurons following bicuculline (50 μm)-induced AP bursting for 1 h in the presence or absence of anisomycin (aniso; 1 μg/ml), actinomycin D (Act D; 10 μg/ml), or cycloheximide (cyclo; 1 μg/ml). Anisomycin, actinomycin D and cycloheximide were added 30 min before stimulation; the percentage of infolded nuclei in unstimulated hippocampal neurons was not affected by the pretreatment with these inhibitors. Statistically significant differences (two-tailed independent samples t test) are indicated with asterisks (***p < 0.001). Error bars indicate SEM.
Figure 8.
Figure 8.
Link between nuclear geometry, activation of MSK1, and the phosphorylation of histone H3 at serine 10. A, B, Immunocytochemical analysis of histone H3 phosphorylation at serine 10 (A, B) and phosphorylation of MSK1 at threonine 581 (B) in cultured hippocampal neurons treated for 1 h with vehicle (control) or bicuculline (50 μm) to induce AP bursting. A, Representative images of phospho-H3 labeled cells. B, Histograms of the average nuclear phospho-H3 and phospho-MSK1 immunoreactivity measured as absolute 8 bit gray levels (Hoechst staining was used to identify nuclei). Number of nuclei analyzed: 198 (control, phospho-H3); 268 (AP bursting, phospho-H3); 130 (control, phospho-MSK1); 182 (AP bursting, phospho-MSK1). ***p < 0.001, independent samples t test. Error bars indicate SEM. C, Assessment of the degree of nuclear infolding in hippocampal neurons treated for 1 h with vehicle (control) or with bicuculline (50 μm) to induce AP bursting. Lamin B or lamin A/C immunoreactivity was used to categorize the nuclei as near-spherical/not infolded (n), weakly infolded (category 1), moderately infolded (category 2), and highly infolded (category 3); the criteria used are outlined in Results. Representative examples (left panel; category of infoldings is indicated for individual nuclei) and a pie chart summarizing the quantitative analysis (right panel) are shown; number of nuclei analyzed: 217 (control, no infolding), 85 (control, category 1), 26 (control, category 2), 111 (AP bursting, no infolding), 155 (AP bursting, category 1), 111 (AP bursting, category 2), 73 (AP bursting, category 3). D, E, Immunostaining analysis using antibodies to lamin A/C (to assess nuclear infoldings; Hoechst staining was used to identify nuclei) and antibodies to phospho-H3 (D) or to phospho-MSK1 (E) of hippocampal neurons treated for 1 h with vehicle (control) or with bicuculline (50 μm) to induce AP bursting. Representative examples (left panels) and a summary of the quantitative analysis (right panels) are shown; for number of nuclei analyzed see C. ***p < 0.001, **p < 0.005, ANOVA followed by Tukey post hoc test. Error bars indicate SEM. Scale bars, 10 μm.
Figure 9.
Figure 9.
Action potential bursting induces nuclear infoldings and histone H3 phosphorylation at serine 10 in the pyramidal cell layer of hippocampal organotypic slice cultures (OTCs). A, Calcium imaging with Oregon Green 488 BAPTA-1 (OGB-1) in area CA1 of an OTC before and after bicuculline (50 μm) treatment. Representative differential interference contrast (DIC) and fluorescence (OGB-1) images of CA1 are shown on the left panels (strat. or. = stratum oriens, strat. pyr. = stratum pyramidale, strat. rad. = stratum radiatum). Calcium signals shown on the right panels were measured in the stratum pyramidale. The gray lines represent individual traces of calcium transients measured in 30 randomly selected cells; the average calcium signals of all 30 cells are shown as black lines. The arrows indicate the time points of bicuculline application. B, C, Immunostaining of a vehicle-treated OTC (B) and an OTC treated for 1 h with bicuculline (C) using lamin A/C antibodies and antibodies specific for the serine 10-phosphorylated form of histone H3. Representative images are shown. Top, Wide field images. The bright speckles in the phospho-histone H3 section represent nuclei of superficial cells (i.e., glial cells), which were undergoing cell division at the time of the experiment. Scale bar, 500 μm. Middle panels, High-resolution confocal images of the area CA1 of the OTCs shown in the top. Bottom, High-magnification images of lamin A/C stainings (left; scale bar, 10 μm) and merged image of all three signals (right; scale bar, 50 μm). D, Quantitative analysis of nuclear infoldings in OTCs. Vehicle-exposed (control) and stimulated (1 h AP bursting induced by 50 μm bicuculline) OTCs treated as indicated with MK-801 (20 μm), TTX (1 μm), or UO126 (10 μm) were fixed and processed for lamin A/C immunostaining. Nuclei of pyramidal neurons from the CA1 region of OTCs were categorized based on the lamin A/C immunostaining and according to the criteria described in the legend of Figure 8C. Statistical analysis (ANOVA followed by Tukey's post hoc test) was done on bicuculline-treated vs control OTCs within each inhibitor-treated group and between different inhibitor-treated groups within the bicuculline-treated group and was indicated with asterisks (***p < 0.001; **p < 0.005; *p < 0.05; n/s, not significant). Error bars indicate SEM. E, Analysis of histone H3 phosphorylation in nuclei of different infolding categories. Intensities of the mean histone H3-phosphorylation signal averaged from 399 vehicle-treated (control) and 458 bicuculline-treated (AP bursting) neurons from OTCs are plotted with respect to their degree of infoldings. Pie charts indicate relative fractions of the four infoldings categories analyzed. Statistically significant differences (ANOVA followed by Tukey's post hoc test) are indicated with asterisks (***p < 0.001). Error bars indicate SEM.

Similar articles

Cited by

References

    1. Akhtar A, Gasser SM. The nuclear envelope and transcriptional control. Nat Rev Genet. 2007;8:507–517. - PubMed
    1. al-Mohanna FA, Caddy KW, Bolsover SR. The nucleus is insulated from large cytosolic calcium ion changes. Nature. 1994;367:745–750. - PubMed
    1. Arnold FJ, Hofmann F, Bengtson CP, Wittmann M, Vanhoutte P, Bading H. Microelectrode array recordings of cultured hippocampal networks reveal a simple model for transcription and protein synthesis-dependent plasticity. J Physiol. 2005;564:3–19. - PMC - PubMed
    1. Augustine GJ, Neher E. Neuronal Ca2+ signalling takes the local route. Curr Opin Neurobiol. 1992;2:302–307. - PubMed
    1. Bading H. Transcription-dependent neuronal plasticity: the nuclear calcium hypothesis. Eur J Biochem. 2000;267:5280–5283. - PubMed

Publication types

MeSH terms

LinkOut - more resources