. 2009 Nov 25;29(47):14701-12.
doi: 10.1523/JNEUROSCI.2728-09.2009.

Role of striatum in updating values of chosen actions

Affiliations

Role of striatum in updating values of chosen actions

Hoseok Kim et al. J Neurosci. .

Abstract

The striatum is thought to play a crucial role in value-based decision making. Although a large body of evidence suggests its involvement in action selection as well as action evaluation, underlying neural processes for these functions of the striatum are largely unknown. To obtain insights on this matter, we simultaneously recorded neuronal activity in the dorsal and ventral striatum of rats performing a dynamic two-armed bandit task, and examined temporal profiles of neural signals related to animal's choice, its outcome, and action value. Whereas significant neural signals for action value were found in both structures before animal's choice of action, signals related to the upcoming choice were relatively weak and began to emerge only in the dorsal striatum approximately 200 ms before the behavioral manifestation of the animal's choice. In contrast, once the animal revealed its choice, signals related to choice and its value increased steeply and persisted until the outcome of animal's choice was revealed, so that some neurons in both structures concurrently conveyed signals related to animal's choice, its outcome, and the value of chosen action. Thus, all the components necessary for updating values of chosen actions were available in the striatum. These results suggest that the striatum not only represents values associated with potential choices before animal's choice of action, but might also update the value of chosen action once its outcome is revealed. In contrast, action selection might take place elsewhere or in the dorsal striatum only immediately before its behavioral manifestation.


Figures

Figure 1.
Figure 1.
Behavioral task, recording sites and performance of animals. A, Two-armed bandit task. Rats were tested on a modified figure 8-shaped maze to choose between two locations (yellow discs) that delivered water reward with different probabilities. Scale bar, 10 cm. Green arrows indicate the locations of photobeam detectors. B, Unit signals were recorded in the DS and VS by implanting 12 tetrodes (schematically indicated by 12 vertical lines) in three rats. The photomicrograph shows a coronal section of the brain that was stained with cresyl violet. Two marking lesions, one in the DS and the other in the VS, are shown (white arrows). CPu, Caudate/putamen; Acb, nucleus accumbens. C, An example of animal's choice behavior in a single behavioral session. The probability to choose the left arm (PL) is plotted (moving average of 10 trials) across four blocks of trials (gray curve: actual choice of the animal, black curve: choice probability predicted by RL model). Tick marks denote trial-by-trial choices of the animal (upper, left choice; lower, right choice; long, rewarded trial; short, unrewarded trial). Block transitions are marked by vertical lines. Numbers on top indicate mean reward probabilities associated with left and right choices in each block. D, Average regression coefficients from a logistic regression model showing the effects of past choices and rewards on animal's choice. The influence of past choices and past rewards (up to 10 trials) on the current choice was estimated by fitting a logistic regression model to the behavioral data for each animal. Error bars, 95% confidence intervals.
Figure 2.
Figure 2.
Behavioral stages and animal's locomotive trajectory. A, The task was divided into five behavioral stages: delay (D), go (G), approach to reward (A), reward (Rw), and return (Rt) stages. Blue circles indicate the locations of water delivery. Dotted lines indicate approximate stage transition points. Each trial began when the animal crossed the blue dotted line (onset of the delay stage). Scale bar, 10 cm. B, Movement trajectories during an example session. Each dot indicates animal's head position that was sampled at 60 Hz. Green solid lines indicate stage transitions. Beginning from the reward onset, blue and red traces indicate trials associated with left and right upcoming choice of the animal, respectively. Trials were decimated (3 to1) to enhance visibility. C, D, The time course of horizontal (X) coordinates of animal's position data near the onset of the approach stage during an example recording session shown in B (C, individual trials; D, mean). Blue and red indicate trials associated with left and right goal choice, respectively. Green dotted line (0 ms) corresponds to the time when the animal reached a particular vertical position (horizontal dotted line in B) determined by visual inspection to show clear separation in the animal's X positions according to its choice, whereas the gray line corresponds to the time when the difference in the X positions for the left- and right-choice trials first became statistically significant (t test, p < 0.05) within ± 0.5 s time window.
Figure 3.
Figure 3.
Striatal activity related to animal's choice and its outcome in the current and previous trials. A, The graphs show fractions of neurons that were significantly modulated by animal's choice (C), its outcome (R), or their interaction (X) in the current (t) and previous trials (t − 1 and t − 2) in the regression Model 1 in non-overlapping 0.5 s time windows across different behavioral stages [pre-Delay: last 1 s of the return stage; Delay: the entire delay stage (3 s); Go: first 1 s; pre-Approach (pre-Appr): last 1 s of the go stage; Approach: first 1 s; Reward: first 2 s; Return: first 1 s]. Large open circles indicate that the fractions are significantly different between the DS and VS (χ2 test, p < 0.05). Each vertical line indicates the beginning of a given behavioral stage. Values within the shaded areas are not significantly different from the significance level of p = 0.05 for the VS (binomial test). The threshold for the DS is slightly lower due to the larger number of neurons (data not shown). B, The fraction of neurons that significantly modulated their activity according to the current choice [C(t)] is plotted at a higher temporal resolution (100 ms moving window advanced in steps of 50 ms).
Figure 4.
Figure 4.
An example neuron in the VS that modulated its activity according to the animal's choices in the current and previous trials. Trials were grouped according to the sequence of the previous and current trial (L, left; R, right; e.g., RL, right and left choice in the previous and current trial, respectively). Left, Spike raster plots. Right, Spike density functions that were generated by applying a Gaussian kernel (σ = 100 ms) to the corresponding spike trains.
Figure 5.
Figure 5.
Neural signals related to action value and chosen value. A, The graphs show fractions of neurons that significantly modulated their activity according to action value [QL(t) and QR(t)] or chosen value [Qc(t)] in the regression Model 2 tested with non-overlapping 0.5 s time windows. Results for the other variables (current choice, current reward, and their interaction) are also shown. Same format as in Figure 3. B, The fractions of neurons that were significantly modulated by chosen value (orange) and current reward (blue) around the time of reward delivery are shown at a higher temporal resolution. The dotted lines show the minimum values that are significantly higher than the significance level of 0.05 (binomial test). Note that y-axis scales are different for the reward and chosen value signals.
Figure 6.
Figure 6.
Relationship between regression coefficients related to chosen value in the left and right goal choice trials. Trials were divided according to animal's goal choice and discharge rates in the first 1 s of the reward stage were used for this analysis. The graphs show coefficients for chosen value [left and right Qc(t) coeff] in the regression Model 6. Orange and red circles denote neurons encoding chosen value (Model 2) and those with significant choice × chosen value interaction (Model 5), respectively, whereas green circles indicate neurons encoding chosen value (Model 2) and showing significant choice × chosen value interaction (Model 5). The neurons encoding chosen value (Model 2) were used to determine the best-fitting lines (orange lines) and to calculate the correlation coefficients shown, both of which were significantly different from 0 (DS: p < 0.001; VS: p = 0.029).
Figure 7.
Figure 7.
An example neuron in the DS that modulated its activity according to animal's choice, its outcome as well as chosen value in the reward stage. A, Spike density functions (Gaussian kernel width = 100 ms) for different levels of chosen value are shown for the left and right goal-choice trials. This neuron also modulated its activity significantly according to choice × chosen value interaction (Model 5). The trials were divided into four groups according to the level of associated chosen value, and then spike density functions of the four groups were plotted in different colors. Neural activity in the approach and reward stages decreased with the left action value when the animal chose the left goal, and therefore encoded the chosen value in such trials. B, Spike density functions for the left versus right goal choice trials. C, Spike density functions for rewarded (Rw) versus unrewarded (No Rw) trials.
Figure 8.
Figure 8.
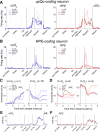
Neuronal activity encoding updated value or RPE. A, An example VS neuron in which activity was correlated more strongly with updated chosen value [upQc] than RPE (Models 8 and 9). B, An example DS neuron in which activity was more correlated with RPE. For comparison, spike density functions (Gaussian kernel width = 100 ms) were estimated separately for different ranges of updated chosen value as well as RPE. C, D, Population-average spike density functions are shown for 1 s before and 2 s after the onset of the reward stage. Neurons that significantly modulated their activity according to both reward [R(t)] and chosen value [Qc(t)] were divided into four groups according to the signs of their regression coefficients (the number of samples in each group is indicated in each plot). Activity of neurons with the same signs (n = 17) was more correlated with updated value than RPE, and therefore their spike density functions were plotted according to updated chosen value (C), whereas activity of neurons with opposite signs (n = 16) was more correlated with RPE and their spike density functions were plotted according to RPE (D). Activity of each neuron was normalized by each neuron's maximal response before averaging. E, F, The coefficient of partial determination (CPD) for RPE and updated value is shown for all behavioral stages in a moving window of 100 ms advanced in 50 ms steps. Only RPE- and updated value-coding neurons (n = 16 and 17, respectively) were selected in plotting the CPD for RPE and updated value, respectively.
Figure 9.
Figure 9.
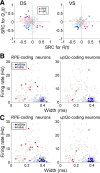
Characteristics of RPE- and updated value-coding neurons. A, Standardized regression coefficients (SRC) related to chosen value (ordinate) and current reward (abscissa) for activity during the first 1 s of the reward stage (Model 7). Saturated colors indicate neurons encoding both reward and chosen value, whereas light colors indicate those that encoded either reward or chosen value only. The rest are indicated in gray. Red and blue indicate those neurons in which activity was more correlated with RPE- or updated chosen value, respectively (Models 8 and 9). B, Scatter plots for mean firing rate and spike width. Saturated colors indicate neurons encoding RPE- (left) or updated value (right) and light colors indicate the remaining neurons. Blue and red indicate putative MSNs and interneurons, respectively. C, Same as in B except that neurons were selected at α = 0.1. DS and VS neurons are combined in B and C.

Similar articles

Cited by

References

    1. Albin RL, Young AB, Penney JB. The functional anatomy of basal ganglia disorders. Trends Neurosci. 1989;12:366–375. - PubMed
    1. Alexander GE, Crutcher MD. Functional architecture of basal ganglia circuits: neural substrates of parallel processing. Trends Neurosci. 1990a;13:266–271. - PubMed
    1. Alexander GE, Crutcher MD. Preparation for movement: neural representations of intended direction in three motor areas of the monkey. J Neurophysiol. 1990b;64:133–150. - PubMed
    1. Apicella P, Scarnati E, Ljungberg T, Schultz W. Neuronal activity in monkey striatum related to the expectation of predictable environmental events. J Neurophysiol. 1992;68:945–960. - PubMed
    1. Atallah HE, Lopez-Paniagua D, Rudy JW, O'Reilly RC. Separate neural substrates for skill learning and performance in the ventral and dorsal striatum. Nat Neurosci. 2007;10:126–131. - PubMed

Publication types

MeSH terms

LinkOut - more resources