. 2009 Nov 25;29(47):14713-25.
doi: 10.1523/JNEUROSCI.2660-09.2009.

Tripartite purinergic modulation of central respiratory networks during perinatal development: the influence of ATP, ectonucleotidases, and ATP metabolites

Affiliations

Tripartite purinergic modulation of central respiratory networks during perinatal development: the influence of ATP, ectonucleotidases, and ATP metabolites

Adrianne G Huxtable et al. J Neurosci. .

Abstract

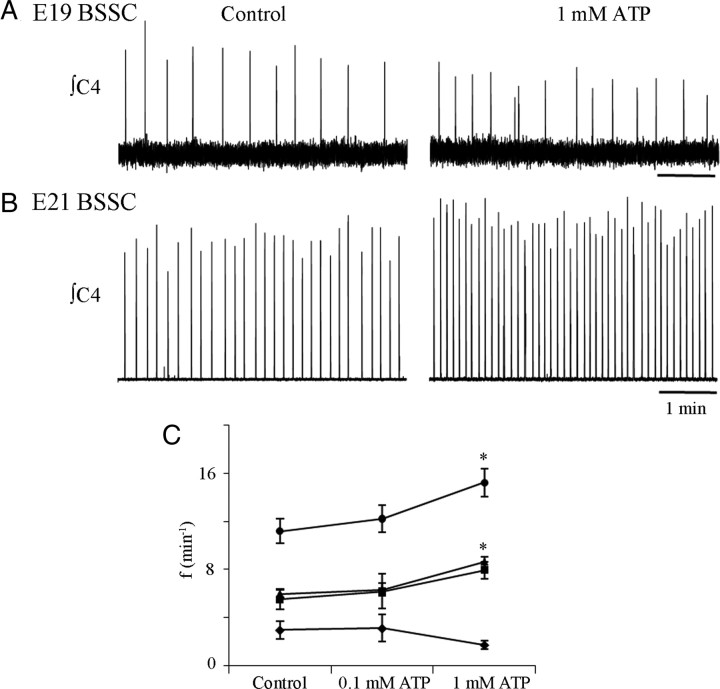
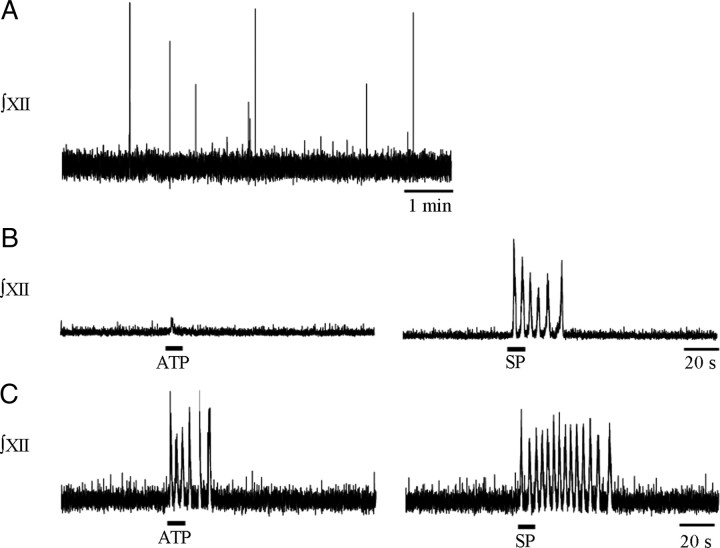
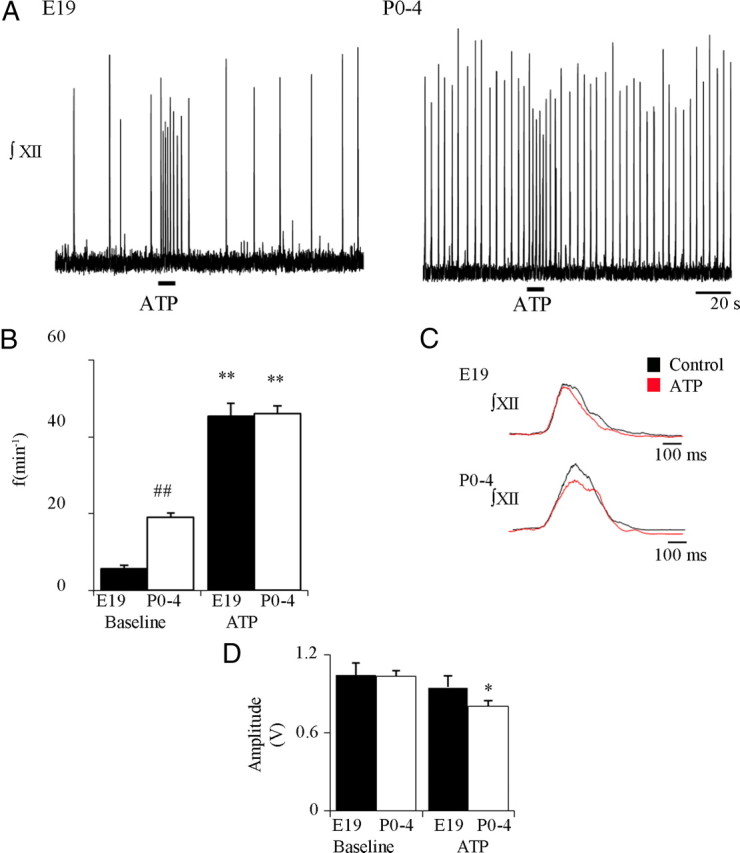
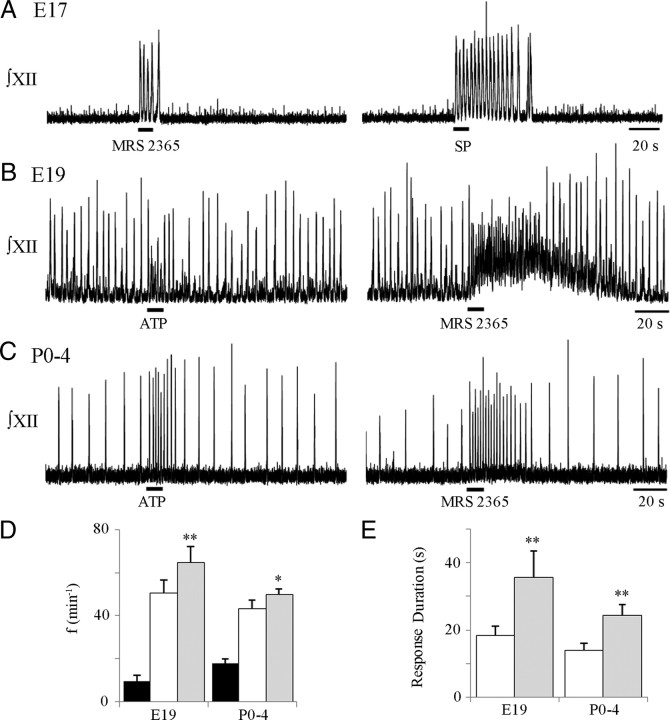
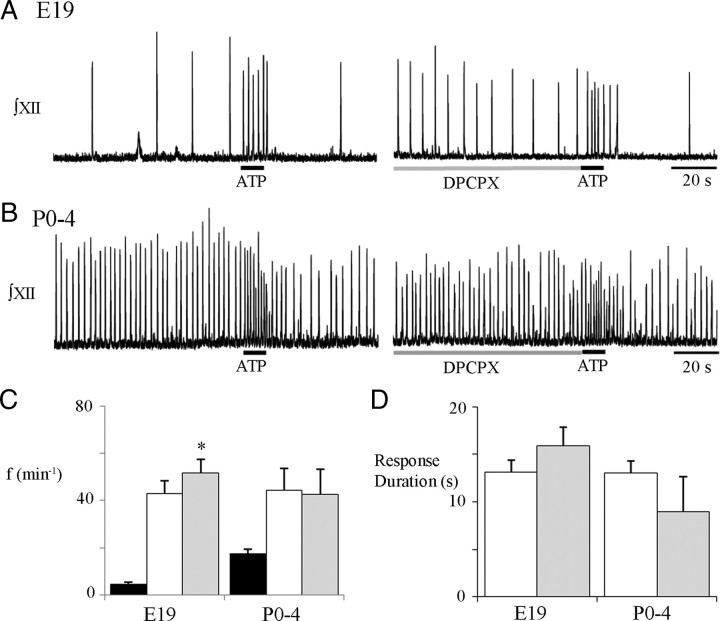
ATP released during hypoxia from the ventrolateral medulla activates purinergic receptors (P2Rs) to attenuate the secondary hypoxic depression of breathing by a mechanism that likely involves a P2Y(1)R-mediated excitation of preBötzinger complex (preBötC) inspiratory rhythm-generating networks. In this study, we used rhythmically active in vitro preparations from embryonic and postnatal rats and ATP microinjection into the rostral ventral respiratory group (rVRG)/preBötC to reveal that these networks are sensitive to ATP when rhythm emerges at embryonic day 17 (E17). The peak frequency elicited by ATP at E19 and postnatally was the same ( approximately 45 bursts/min), but relative sensitivity was threefold greater at E19, reflecting a lower baseline frequency (5.6 +/- 0.9 vs 19.0 +/- 1.3 bursts/min). Combining microinjection techniques with ATP biosensors revealed that ATP concentration in the rVRG/preBötC falls rapidly as a result of active processes and closely correlates with inspiratory frequency. A phosphate assay established that preBötC-containing tissue punches degrade ATP at rates that increase perinatally. Thus, the agonist profile [ATP/ADP/adenosine (ADO)] produced after ATP release in the rVRG/preBötC will change perinatally. Electrophysiology further established that the ATP metabolite ADP is excitatory and that, in fetal but not postnatal animals, ADO at A(1) receptors exerts a tonic depressive action on rhythm, whereas A(1) antagonists extend the excitatory action of ATP on inspiratory rhythm. These data demonstrate that ATP is a potent excitatory modulator of the rVRG/preBötC inspiratory network from the time it becomes active and that ATP actions are determined by a dynamic interaction between the actions of ATP at P2 receptors, ectonucleotidases that degrade ATP, and ATP metabolites on P2Y and P1 receptors.


Figures

Figure 1.
Figure 1.
Sensitivity of BSSC preparations to bath-applied ATP emerges between E19 and E21. Inspiratory frequency of E19 (A) and E21 (B) BSSC preparations during control (left) and in the presence of bath-applied ATP (1 mm; right). C, Group data showing the effects of bath-applied ATP (0.1 and 1.0 mm) on inspiratory frequency of BSSC preparations from E17 (n = 12; ♦), E19 (n = 14; ■), E21 (n = 10; ▲), and P0–P4 (n = 6; ●) preparations. *p < 0.01, significant difference from control.
Figure 2.
Figure 2.
Sensitivity of medullary slice preparations to local application of ATP in the rVRG/preBötC emerges near E17. A, E17 preparations exhibited slow, irregular bursting behavior in 7 mm K+. Integrated XII nerve root recordings from two E17 rhythmic medullary slices showing that, in one slice, brief bouts of rhythmic activity could be evoked only by local application of SP (1 μm, 10 s) into the rVRG/preBötC (B), whereas in another slice, both ATP (0.1 mm, 10 s) and SP evoked brief rhythmic activity (C).
Figure 3.
Figure 3.
Perinatal changes in the sensitivity of the medullary slice preparations to local application of ATP to the rVRG/preBötC. A, Integrated XII nerve recordings from E19 and P0–P4 rhythmic medullary slice preparations showing responses to local application of ATP (0.1 mm, 10 s) to the rVRG/preBötC. B, Group data for E19 (n = 24; black bars) and P0–P4 (n = 25; white bars) showing baseline and maximum frequency evoked by ATP. C, Burst profiles averaged from five cycles under control conditions and in the presence of ATP for a representative E19 and a P0–P4 rhythmic slice. D, Effects of locally applied ATP on XII inspiratory burst amplitude (n = 10) for E19 and P0–P4 preparations. *p < 0.01, **p < 0.001, significant difference from baseline within an age group; ##p < 0.001, significant difference between age groups.
Figure 4.
Figure 4.
Activation of P2Y1Rs in the rVRG/preBötC with MRS 2365 evokes a response in E17, E19, and P0–P4 medullary slices. Integrated XII nerve recording from an E17 (A) rhythmic slice shows that MRS 2365 (left; a P2Y1R agonist, 0.1 mm, 10 s) and SP (right; 1 μm, 10 s) applied to the rVRG/preBötC evokes rhythmic bursting. Integrated XII nerve recordings from E19 (B) and P0–P4 (C) rhythmic medullary slice preparations show responses to local application of ATP (left; 0.1 mm, 10 s) and MRS 2365 (right; 0.1 mm, 10 s) to the rVRG/preBötC. D, Group data for E19 (n = 6) and P0–P4 (n = 8) slices showing baseline frequencies (black bars) and frequencies evoked by ATP (white bars) and MRS 2365 (gray bars). E, Average duration of responses evoked by ATP (white bars) and MRS 2365 (gray bars) for E19 (n = 4) and P0–P4 (n = 8). *p < 0.05, **p < 0.001, significant difference between response in MRS 2365 and ATP within an age group.
Figure 5.
Figure 5.
Local application of ATP into the rVRG/preBötC evokes a frequency response that closely follows the ATP concentration profile. Plots show, in a single medullary slice preparation, the effects of locally applying ATP within the rVRG/preBötC (0.1 mm, 10 s, starting at t = 0) on inspiratory frequency measured from integrated XII nerve recording (black traces) and the ATP difference current (ATP sensor current − null sensor current) within the rVRG/preBötC (gray traces). Consecutive responses to ATP applied at the same site, 15 min apart (left and middle). Inspiratory frequency and ATP difference current recorded in response to locally applying ATP at a site 140 μm medial to the initial site in the rVRG/preBötC (0.1 mm, 10 s; right).
Figure 6.
Figure 6.
ATP movement is restricted in live compared with dead medullary tissue. Plot showing the ATP difference current evoked in live (gray lines) and dead (black lines) slices by local application of ATP (0.1 mm, 10 s) into the VRC (Site 1, A) and at distances 140 μm (Site 2, B), and 280 μm (Site 3, C) medial to site 1. D, Histogram of group data (n = 4) showing the area under the ATP difference current versus time curve (proportional to the amount of ATP detected) of a control application in which ATP was applied adjacent to the sensors when both were above the tissue (calibration) and again when sensors were in the VRC and the injection pipette was at sites 1, 2, and 3. *p < 0.05, significant difference from site 1; #p < 0.05, significant difference from calibration; @p < 0.05, significant difference between dead and live sites.
Figure 7.
Figure 7.
Ectonucleotidase activity measured through the rate of phosphate production from medullary slices or tissue punches containing the VRC and XII nuclei. A, Group data showing phosphate produced by P0–P4 rhythmic medullary slices under control conditions (no ATP or POM-1 only; n = 7) and in the presence of ATP (0.05 mm; n = 7) or ATP and the ectonucleotidase inhibitor POM-1 (0.1 mm; n = 7). ***p < 0.001, significant difference between ATP and all other conditions. B, Phosphate production in live and dead P0–P4 rhythmic medullary slices. *p < 0.05 (n = 3). C, An example standard curve, like that generated for each experiment, shows the relationship between optical density (OD630 nm) and phosphate concentration. Group data showing the relationship between amount of phosphate produced and time for VRC (gray lines) and XII (black lines) punches for E19 (D; n = 11) and P0–P4 (E; n = 9) preparations. The slope of the relationship indicates rate of phosphate production. F, Histograms of group data showing average rate of phosphate produced by VRC and XII punches for E19 (black bars) and P0–P4 (white bars) preparations. **p < 0.01, ***p < 0.001, significant difference between E19 and P0–P4.
Figure 8.
Figure 8.
Perinatal changes in the influence of A1R receptors on baseline frequency. Local application of an A1R antagonist (2 μm DPCPX, 120 s) into the rVRG/preBötC alters baseline frequency in E19 (A) but not P0–P4 (B) slices. Group data (C) showing the influence of A1R antagonism on baseline frequency for E19 (n = 9) and P0–P4 (n = 6) slices. *p < 0.01, significant difference from control.
Figure 9.
Figure 9.
Perinatal changes in the effects of A1R antagonism on the ATP-evoked frequency increase. Integrated XII recordings from E19 (A) and P0–P4 (B) rhythmic slices after local application of ATP (0.1 mm, 10 s; left) under control conditions and after a 2 min preapplication of an A1R antagonist (2 μm DPCPX; right). C, Group data for E19 (n = 9) and P0–P4 (n = 4) slices showing baseline frequency (black bars) and the peak frequency evoked by ATP alone (white bars) and after DPCPX (gray bars). D, Duration of the response evoked by ATP alone (white bars) and after preapplication of DPCPX (gray bars) in E19 and P0–P4 preparations. *p < 0.001, difference from ATP response.

Similar articles

Cited by

  • Regulation of adenosine levels during cerebral ischemia.
    Chu S, Xiong W, Zhang D, Soylu H, Sun C, Albensi BC, Parkinson FE. Chu S, et al. Acta Pharmacol Sin. 2013 Jan;34(1):60-6. doi: 10.1038/aps.2012.127. Epub 2012 Oct 15. Acta Pharmacol Sin. 2013. PMID: 23064722 Free PMC article. Review.
  • Functional Oxygen Sensitivity of Astrocytes.
    Angelova PR, Kasymov V, Christie I, Sheikhbahaei S, Turovsky E, Marina N, Korsak A, Zwicker J, Teschemacher AG, Ackland GL, Funk GD, Kasparov S, Abramov AY, Gourine AV. Angelova PR, et al. J Neurosci. 2015 Jul 22;35(29):10460-73. doi: 10.1523/JNEUROSCI.0045-15.2015. J Neurosci. 2015. PMID: 26203141 Free PMC article.
  • Morphometric analysis of astrocytes in brainstem respiratory regions.
    SheikhBahaei S, Morris B, Collina J, Anjum S, Znati S, Gamarra J, Zhang R, Gourine AV, Smith JC. SheikhBahaei S, et al. J Comp Neurol. 2018 Sep 1;526(13):2032-2047. doi: 10.1002/cne.24472. Epub 2018 Aug 22. J Comp Neurol. 2018. PMID: 29888789 Free PMC article.
  • P2Y1 receptor-mediated potentiation of inspiratory motor output in neonatal rat in vitro.
    Alvares TS, Revill AL, Huxtable AG, Lorenz CD, Funk GD. Alvares TS, et al. J Physiol. 2014 Jul 15;592(14):3089-111. doi: 10.1113/jphysiol.2013.268136. Epub 2014 May 30. J Physiol. 2014. PMID: 24879869 Free PMC article.
  • ATP, glia and central respiratory control.
    Erlichman JS, Leiter JC, Gourine AV. Erlichman JS, et al. Respir Physiol Neurobiol. 2010 Oct 31;173(3):305-11. doi: 10.1016/j.resp.2010.06.009. Epub 2010 Jun 23. Respir Physiol Neurobiol. 2010. PMID: 20601205 Free PMC article. Review.

References

    1. Abbracchio MP, Boeynaems JM, Barnard EA, Boyer JL, Kennedy C, Miras-Portugal MT, King BF, Gachet C, Jacobson KA, Weisman GA, Burnstock G. Characterization of the UDP-glucose receptor (re-named here the P2Y14 receptor) adds diversity to the P2Y receptor family. Trends Pharmacol Sci. 2003;24:52–55. - PMC - PubMed
    1. Alvarado-Castillo C, Harden TK, Boyer JL. Regulation of P2Y1 receptor-mediated signaling by the ectonucleoside triphosphate diphosphohydrolase isozymes NTPDase1 and NTPDase2. Mol Pharmacol. 2005;67:114–122. - PubMed
    1. Anguio y Gonzalez. The prenatal growth of the albino rat. Anat Rec. 1932;52:117–138.
    1. Barrington K, Finer N. The natural history of the appearance of apnea of prematurity. Pediatr Res. 1991;29:372–375. - PubMed
    1. Bhatt-Mehta V, Schumacher RE. Treatment of apnea of prematurity. Paediatr Drugs. 2003;5:195–210. - PubMed

Publication types

MeSH terms

LinkOut - more resources