. 2009 Nov 25;29(47):14891-902.
doi: 10.1523/JNEUROSCI.4060-09.2009.

The dorsomedial striatum reflects response bias during learning

Affiliations

The dorsomedial striatum reflects response bias during learning

Eyal Y Kimchi et al. J Neurosci. .

Abstract

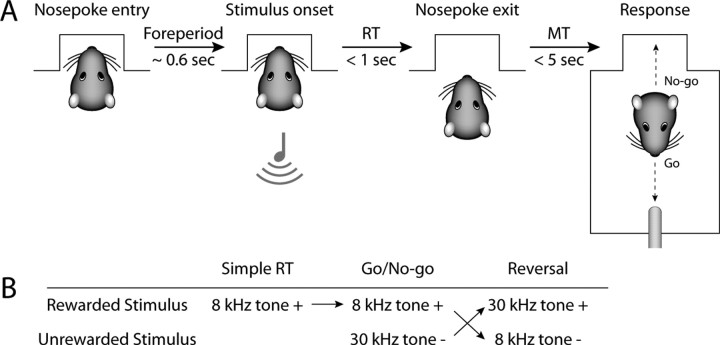
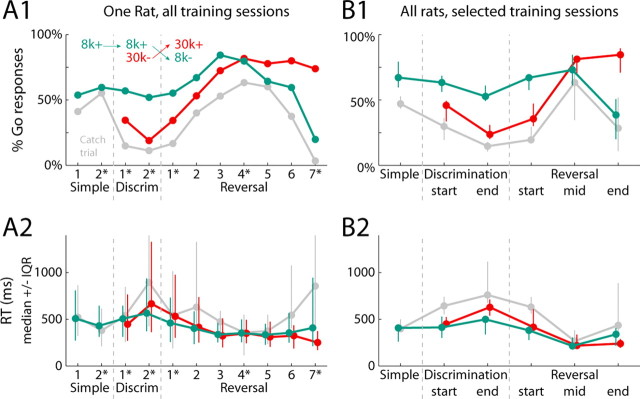
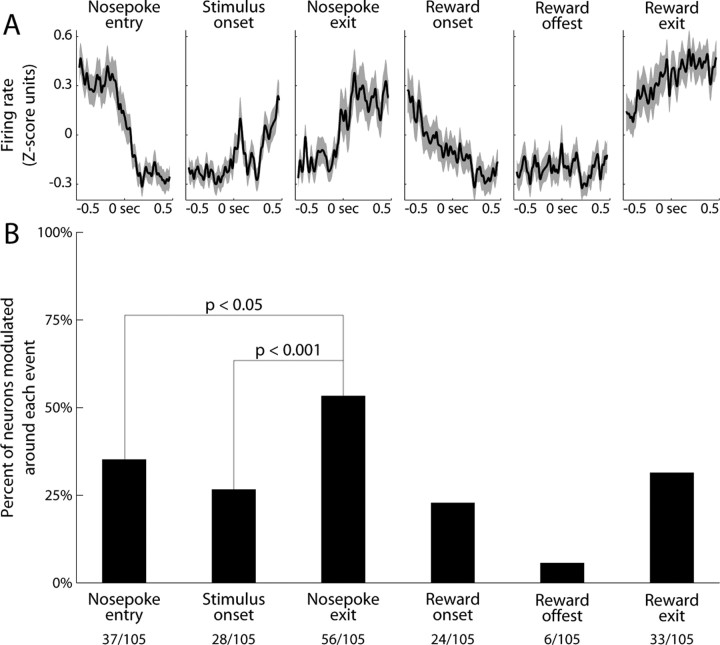
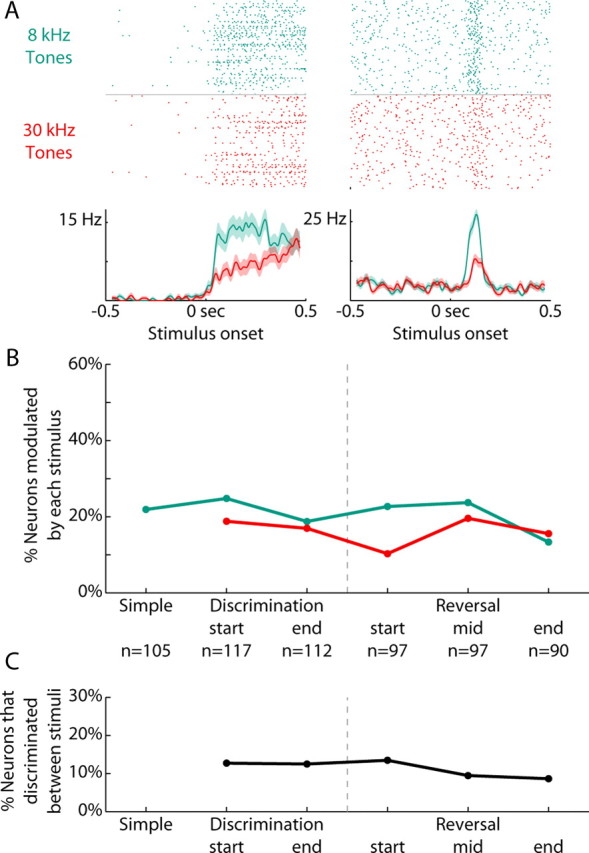
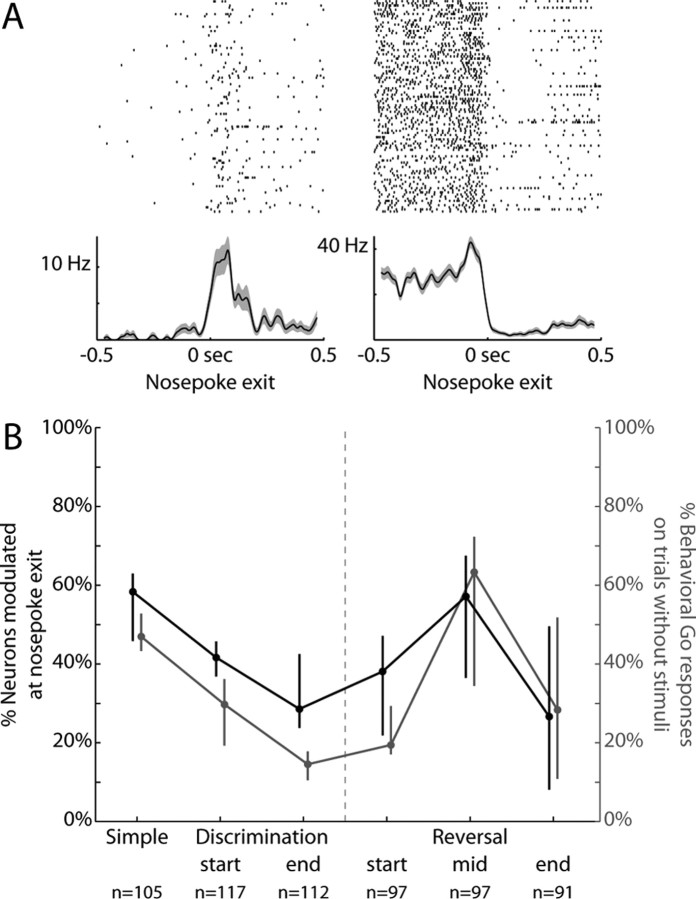
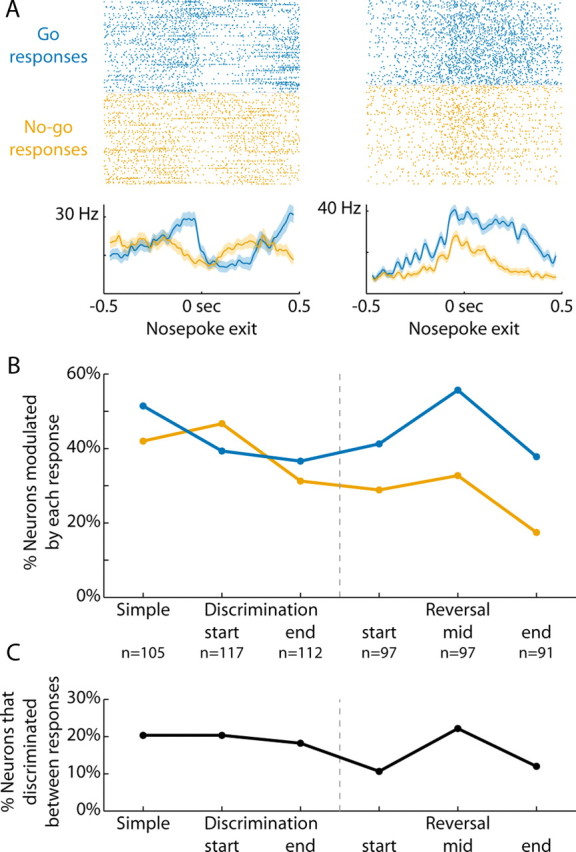
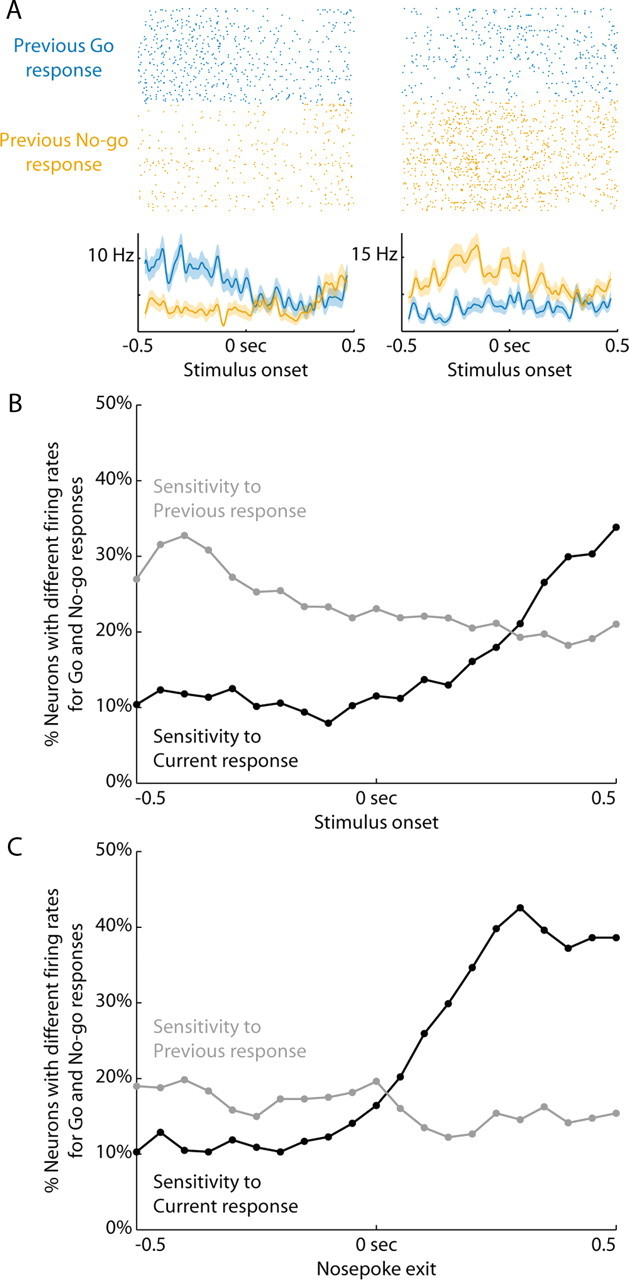
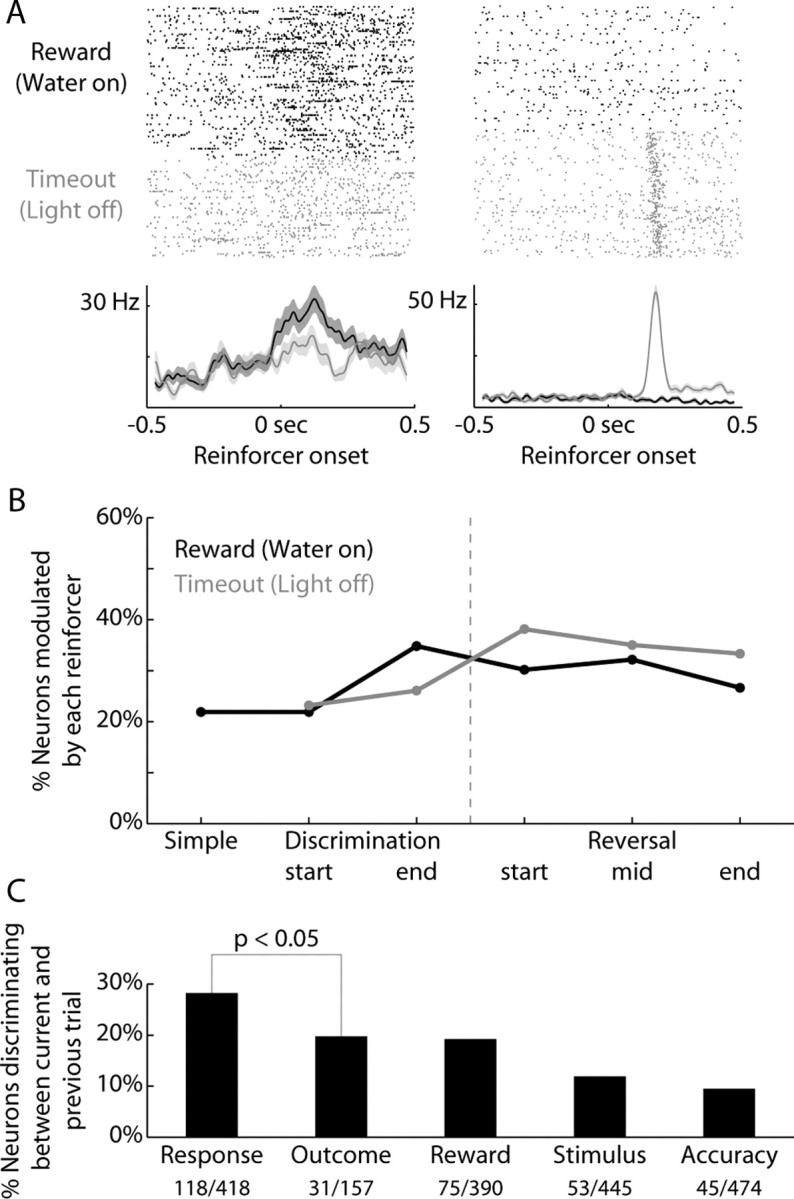
Previous studies have established that neurons in the dorsomedial striatum track the behavioral significance of external stimuli, are sensitive to contingencies between actions and outcomes, and show rapid flexibility in representing task-related information. Here, we describe how neural activity in the dorsomedial striatum changes during the initial acquisition of a Go/NoGo task and during an initial reversal of stimulus-response contingencies. Rats made nosepoke responses over delay periods and then received one of two acoustic stimuli. Liquid rewards were delivered after one stimulus (S+) if the rats made a Go response (entering a reward port on the opposite wall of the chamber). If a Go response was made to other stimulus (S-), rats experienced a timeout. On 10% of trials, no stimulus was presented. These trials were used to assess response bias, the animals' tendency to collect reward independent of the stimulus. Response bias increased during the reversal, corresponding to the animals' uncertainty about the stimulus-response contingencies. Most task-modulated neurons fired during the response at the end of the delay period. The fraction of response-modulated neurons was correlated with response bias and neural activity was sensitive to the behavioral response made on the previous trial. During initial task acquisition and initial reversal learning, there was a remarkable change in the percentages of neurons that fired in relation to the task events, especially during withdrawal from the nosepoke aperture. These results suggest that changes in task-related activity in the dorsomedial striatum during learning are driven by the animal's bias to collect rewards.


Figures

Figure 1.
Figure 1.
Behavioral paradigm. A, Trials began when rats inserted their snout into the nosepoke aperture. If they maintained this posture for 0.6 s (delay period), an auditory stimulus was presented. Rats then had to withdraw from the nosepoke within 1 s from stimulus onset (RT) and cross the chamber to collect a water reward within 5 s (MT). This was called a Go response. If rats did not attempt to contact the spout promptly this was called a No-go response. On No-go responses, rats typically initiated a new trial by reinserting their snout in the nosepoke aperture. B, The first stage of training used a simple reaction time task, in which an 8 kHz tone was used as the rewarded stimulus (8k+). Go responses to this stimulus were always rewarded. Next, animals experienced discrimination training, and were presented with an equal number of trials using 30 kHz tones as an unrewarded stimulus (30k−). Go responses to the unrewarded stimulus led to a timeout. In reversal training, the values of the two tones reversed, i.e., the 30 kHz tone was now rewarded (30k+) whereas the 8 kHz tone was now unrewarded (8k−). In all sessions, 10% of trials had no stimulus and served as catch trials to assess the rats' bias to respond for reward independent of the stimulus.
Figure 2.
Figure 2.
Behavior measures of discrimination and reversal learning. A, Behavioral data for a single rat across all training sessions. A1, The likelihood of a Go response after each stimulus is shown across training (green = 8 kHz tone; red = 30 kHz tone; gray = no stimulus/catch trial). The inset depicts the reward contingencies in effect at each stage of training. The dashed gray lines mark transitions between training stages (simple RT task, discrimination learning, and reversal). A2, Reaction time data for each trial type are shown across training (median ± IQR). B, Behavioral data are shown from all rats at each stage of training (the first session of reversal training, a session in the middle of reversal training in which rats responded at similar rates to the two stimuli without an RT difference, and a session in which rats achieved criteria performance on the reversed discrimination). It was necessary to select sessions for analysis in this study due to rats requiring different numbers of training sessions to progress through the entire training process. Starred numbers in A indicate the sessions selected for analysis for that particular subject. Conventions for Go responses (B1) and RT data (B2) are as in A.
Figure 3.
Figure 3.
Task-related modulation of firing rate during the simple reaction time task. A, The mean firing rate was visibly modulated around most task events. Neural activity is depicted as the mean normalized firing rate of all neurons. Gray bands depict the SEM. Activity was highest during times of locomotion, but visibly modulated even around stimulus onset. B, The percentage of neurons modulated around each task event was determined by comparing firing rates before and after the event (±200 ms windows, signrank test, p < 0.05). Just over half of all neurons had a modulation of firing rate at nosepoke exit, more than at any other single event in the task.
Figure 4.
Figure 4.
Stimulus-related activity did not change with training. A, Rasters and peri-event time histograms are presented from two neurons that discriminated between the rewarded and unrewarded stimuli. In green are the trials using the rewarded 8 KHz tone (8k+), while in red are the trials using the unrewarded 30 kHz tone (30k−). B, The percentage of neurons modulated around each stimulus (±200 ms, signrank p < 0.05) are plotted across the various stages of training. Neural modulations to 8 kHz tones are in green, modulations to 30 kHz tones are in red. Gray dashed line indicates when reversal occurred (from 8k+/30k− to 30k+/8k−). The n refers to the number of neurons recorded at that stage across all rats. The percentage of neurons modulated around each stimulus did not change significantly over training (ANOVA, effect of training: F(5,78) = 2.0, p = 0.09, interaction between training and stimuli: F(4,78) = 1.2, p = 0.30). C, The percentage of neurons that discriminated between the two stimuli (200 ms following stimulus onset, ranksum p < 0.05) are plotted throughout discrimination and reversal training. The percentage of neurons whose activity discriminated between the two stimuli did not change significantly over training (ANOVA, effect of training: F(4,31) = 0.6, p = 0.70).
Figure 5.
Figure 5.
Response-related activity tracked the behavioral bias to respond. A, Rasters and peri-event time histograms are presented from two neurons whose activity changed around the time of nosepoke exit (±200 ms, signrank p < 0.05). Of the neurons whose activity was modulated around response initiation at the Simple RT stage of training, slightly more than half increased their firing rates following nosepoke exit (as on the left, 61%, 34/56), while the rest decreased their firing rates (as on the right, 39%, 22/56). B, The percentage of neurons with changes in neural activity at nosepoke exit are plotted in black across the various stages of training. There was a significant change in the proportion of neurons modulated throughout training (ANOVA, effect of training during discrimination learning: F(2,16) = 6.8, p < 0.01; effect of training during reversal learning: F(2,15) = 4.6, p < 0.03). The percentage of behavioral Go responses on catch trials is replotted in gray as a measure of bias to respond. The training stages at which there was most likely to be nosepoke-related changes in neural activity were also those during which the response strategy was most likely to be driven by bias. Response-related neural modulations and the behavioral bias to respond were positively correlated for most rats (78%, 7/9; mean r = 0.37, SD = 0.44) and the correlations were significantly >0 across subjects (t test comparison to 0, p < 0.05).
Figure 6.
Figure 6.
Delay period activity reflected action selection. A, Rasters and peri-event time histograms are presented from two neurons that discriminated between Go and No-go responses (Go = blue, No-go = orange; −200 ms window before nosepoke exit, ranksum p < 0.05). B, The percentage of neurons modulated on trials of each response type (±200 ms, signrank p < 0.05) are plotted across the various stages of training. Across subjects, ANOVA revealed significant main effects of training (discrimination learning: F(2,33) = 5.8, p < 0.01; reversal learning: F(2,33) = 5.0, p < 0.02). There was a significant effect of response type (Go or No-go) during reversal learning (F(1,33) = 14.0, p < 0.001), but not during discrimination learning (F(1,33) = 1.0, p > 0.3). C, The percentage of neurons that discriminated between the two responses (−200 ms window before nosepoke exit, ranksum p < 0.05) are plotted throughout discrimination and reversal training. The percentage of neurons whose activity was different showed a statistical trend to change with training (ANOVA, discrimination learning: F(2,9) = 0.1, p > 0.8; reversal learning: F(2,10) = 1.7, p > 0.2).
Figure 7.
Figure 7.
Neural firing rates were sensitive to the previous response. A, Rasters and peri-event time histograms are presented from two neurons sensitive to the previous response (200 ms window at the end of the delay period of the next trial before stimulus onset, ranksum p < 0.05). Trials after a Go response are blue and trials after a No-go response are orange. The neuron on the left fired more after a Go response and the neuron on the right fired more after a No-go response. In the final 200 ms of the delay period, just before a stimulus was delivered, 21% of neurons were sensitive to the previous response (101/474 neurons across training). B, The percentage of neurons sensitive to the previous response (gray) or current response (black) are plotted relative to the onset of the stimulus. A 200 ms sliding window was moved from −0.5 s before the stimulus until 0.5 s after, in 50 ms steps. Data are plotted at the time point signifying the end of the window, i.e., the point at 0 s includes neural activity from the 200 ms before the stimulus. The firing rates in these windows were compared for Go and No-go responses (ranksum, p < 0.05). The percentage of neurons that were sensitive to the previous response decreased as time progressed into the next trial. C, Sensitivity to the previous and current responses are plotted with neural activity aligned to nosepoke exit. Conventions are as in B. Neurons reflected the current response primarily after the animal was already moving.
Figure 8.
Figure 8.
Reward-related activity did not change over training. A, Rasters and peri-event time histograms are presented from two neurons that discriminated between positive and negative outcomes (black = reward, gray = timeout; 200 ms window following reinforcer onset, ranksum p < 0.05). B, The percentage of neurons modulated on trials of each outcome (±200 ms, signrank p < 0.05) are plotted across the various stages of training. There was no effect of stage of training (ANOVA, F(5,60) = 1.6, p = 0.17), reinforcer type (F(1,60) = 1.0, p = 0.32), or interaction between reinforcer and training (F(4,60) = 0.12, p = 0.97). C, The percentage of neurons whose prestimulus activity reflects various previous trial types (Response = previous Go vs No-go response; Outcome = previous reward vs timeout: Reward = previous reward vs no reward, which depends on both previous response and outcome). Neural activity related to the previous outcome was not sustained as readily into the next trial as neural activity related to the previous response (χ2 = 3.8, p < 0.05).

Similar articles

Cited by

References

    1. Adams S, Kesner RP, Ragozzino ME. Role of the medial and lateral caudate-putamen in mediating an auditory conditional response association. Neurobiol Learn Mem. 2001;76:106–116. - PubMed
    1. Andalman AS, Fee MS. A basal ganglia-forebrain circuit in the songbird biases motor output to avoid vocal errors. Proc Natl Acad Sci U S A. 2009;106:12518–12523. - PMC - PubMed
    1. Apicella P, Ljungberg T, Scarnati E, Schultz W. Responses to reward in monkey dorsal and ventral striatum. Exp Brain Res. 1991;85:491–500. - PubMed
    1. Balleine BW, Delgado MR, Hikosaka O. The role of the dorsal striatum in reward and decision-making. J Neurosci. 2007;27:8161–8165. - PMC - PubMed
    1. Berendse HW, Galis-de Graaf Y, Groenewegen HJ. Topographical organization and relationship with ventral striatal compartments of prefrontal corticostriatal projections in the rat. J Comp Neurol. 1992;316:314–347. - PubMed

Publication types

MeSH terms

LinkOut - more resources