Robust coding of ego-motion in descending neurons of the fly
- PMID: 19940195
- PMCID: PMC6665999
- DOI: 10.1523/JNEUROSCI.3786-09.2009
Robust coding of ego-motion in descending neurons of the fly
Abstract
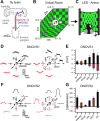
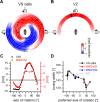
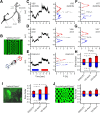
In many species, motion-sensitive neurons responding to optic flow at higher processing stages are well characterized; however, less is known how this representation of ego-motion is further transformed into an appropriate motor response. Here, we analyzed in the blowfly Calliphora vicina the visuomotor transformation from motion-sensitive neurons in the lobula plate [V2 and vertical system (VS) cells] onto premotor descending neurons [descending neurons of the ocellar and vertical system (DNOVS) cells] feeding into the motor circuit of the fly thoracic ganglion. We found that each of these cells is tuned to rotation of the fly around a particular body axis. Comparing the responses of presynaptic and postsynaptic cells revealed that DNOVS cells have approximately the same tuning widths as V2 and VS cells. However, DNOVS signals cells are less corrupted by fluctuations arising from the spatial structure of the visual input than their presynaptic elements. This leads to a more robust representation of ego-motion at the level of descending neurons. Thus, when moving from lobula plate cells to descending neurons, the selectivity for a particular optic flow remains unaltered, but the robustness of the representation increases.
Figures


Similar articles
-
Local and global motion preferences in descending neurons of the fly.J Comp Physiol A Neuroethol Sens Neural Behav Physiol. 2009 Dec;195(12):1107-20. doi: 10.1007/s00359-009-0481-0. Epub 2009 Oct 15. J Comp Physiol A Neuroethol Sens Neural Behav Physiol. 2009. PMID: 19830435 Free PMC article.
-
Integration of lobula plate output signals by DNOVS1, an identified premotor descending neuron.J Neurosci. 2007 Feb 21;27(8):1992-2000. doi: 10.1523/JNEUROSCI.4393-06.2007. J Neurosci. 2007. PMID: 17314295 Free PMC article.
-
Nonlinear integration of binocular optic flow by DNOVS2, a descending neuron of the fly.J Neurosci. 2008 Mar 19;28(12):3131-40. doi: 10.1523/JNEUROSCI.5460-07.2008. J Neurosci. 2008. PMID: 18354016 Free PMC article.
-
Fly motion vision.Annu Rev Neurosci. 2010;33:49-70. doi: 10.1146/annurev-neuro-060909-153155. Annu Rev Neurosci. 2010. PMID: 20225934 Review.
-
Common circuit design in fly and mammalian motion vision.Nat Neurosci. 2015 Aug;18(8):1067-76. doi: 10.1038/nn.4050. Epub 2015 Jun 29. Nat Neurosci. 2015. PMID: 26120965 Review.
Cited by
-
A Descending Neuron Correlated with the Rapid Steering Maneuvers of Flying Drosophila.Curr Biol. 2017 Apr 24;27(8):1200-1205. doi: 10.1016/j.cub.2017.03.004. Epub 2017 Apr 6. Curr Biol. 2017. PMID: 28392112 Free PMC article.
-
Complementary motion tuning in frontal nerve motor neurons of the blowfly.J Comp Physiol A Neuroethol Sens Neural Behav Physiol. 2015 Apr;201(4):411-26. doi: 10.1007/s00359-015-0980-0. Epub 2015 Jan 31. J Comp Physiol A Neuroethol Sens Neural Behav Physiol. 2015. PMID: 25636734
-
Integration of binocular optic flow in cervical neck motor neurons of the fly.J Comp Physiol A Neuroethol Sens Neural Behav Physiol. 2012 Sep;198(9):655-68. doi: 10.1007/s00359-012-0737-y. Epub 2012 Jun 7. J Comp Physiol A Neuroethol Sens Neural Behav Physiol. 2012. PMID: 22674287
-
Neural action fields for optic flow based navigation: a simulation study of the fly lobula plate network.PLoS One. 2011 Jan 31;6(1):e16303. doi: 10.1371/journal.pone.0016303. PLoS One. 2011. PMID: 21305019 Free PMC article.
-
Near-optimal decoding of transient stimuli from coupled neuronal subpopulations.J Neurosci. 2014 Sep 3;34(36):12206-22. doi: 10.1523/JNEUROSCI.2671-13.2014. J Neurosci. 2014. PMID: 25186763 Free PMC article.
References
-
- Borst A, Bahde S. Spatio-temporal integration of motion—a simple strategy for safe landing in flies. Naturwiss. 1988a;75:265–267.
-
- Borst A, Bahde S. Visual information processing in the fly's landing system. J Comp Physiol A Neuroethol Sens Neural Behav Physiol. 1988b;163:167–173.
-
- Borst A, Haag J. Neural networks in the cockpit of the fly. J Comp Physiol A Neuroethol Sens Neural Behav Physiol. 2002;188:419–437. - PubMed
-
- Collett M, Collett TS, Srinivasan MV. Insect navigation: measuring travel distance across ground and through air. Curr Biol. 2006;16:R887–R890. - PubMed
Publication types
MeSH terms
LinkOut - more resources
Full Text Sources
