. 2009 Nov 25;29(47):15001-16.
doi: 10.1523/JNEUROSCI.3827-09.2009.

Inhibition of adult rat retinal ganglion cells by D1-type dopamine receptor activation

Affiliations

Inhibition of adult rat retinal ganglion cells by D1-type dopamine receptor activation

Yuki Hayashida et al. J Neurosci. .

Abstract

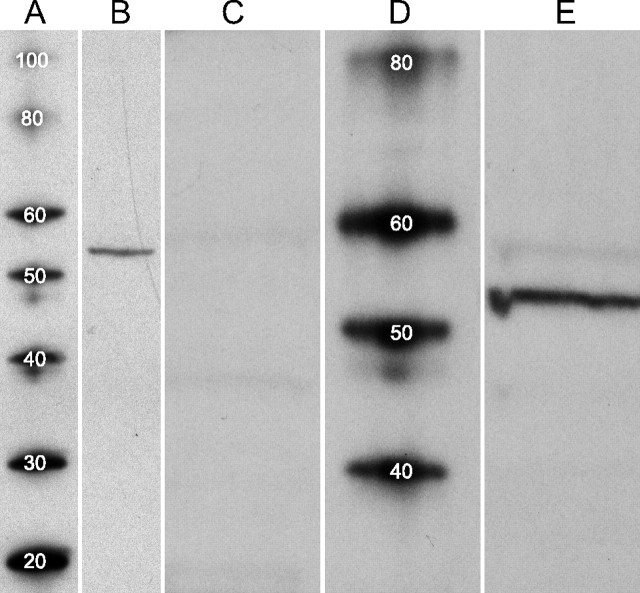
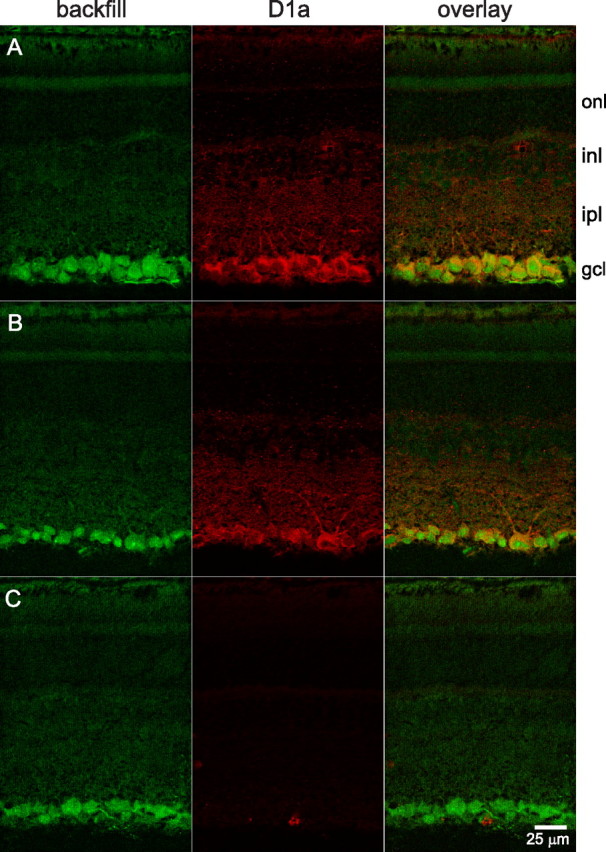
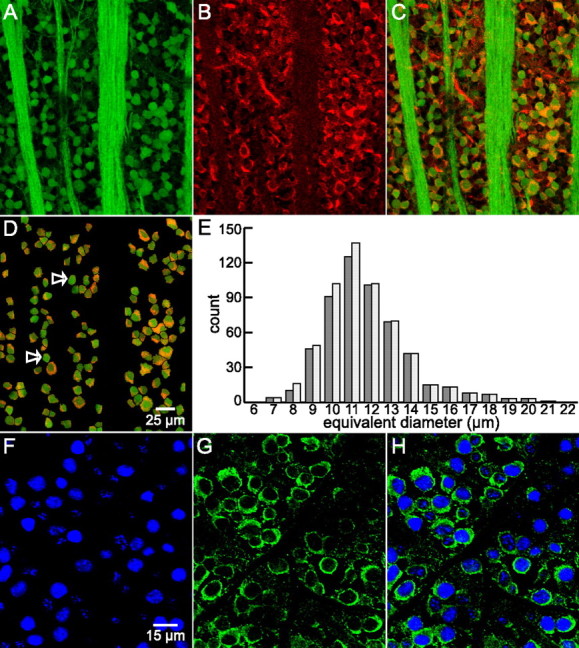
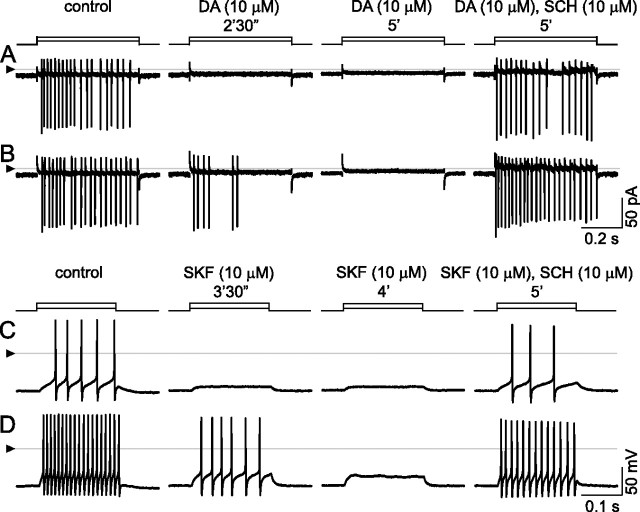
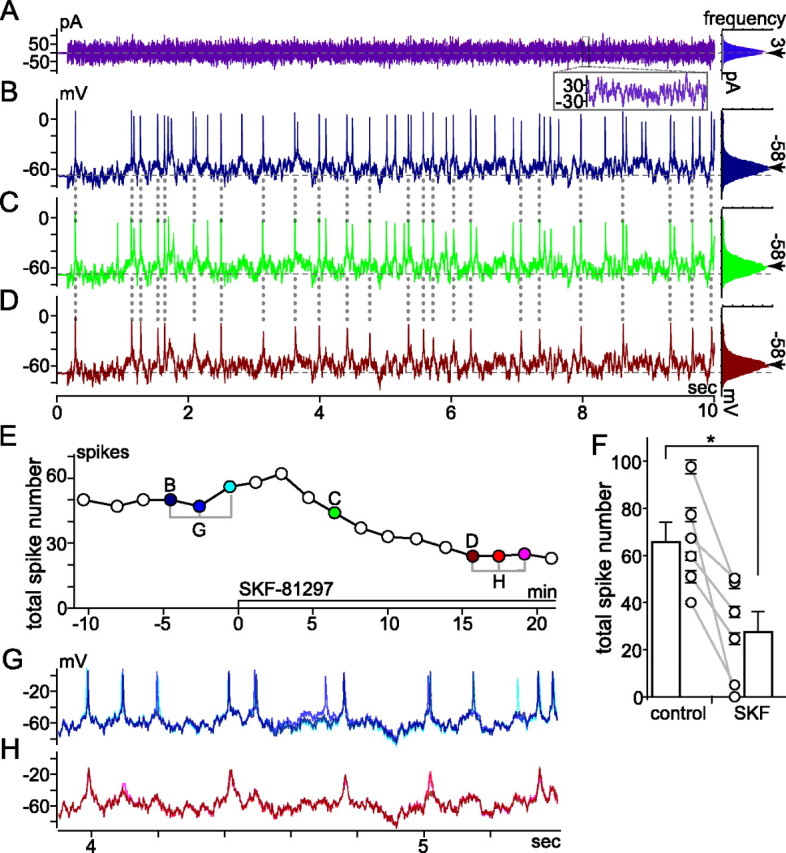
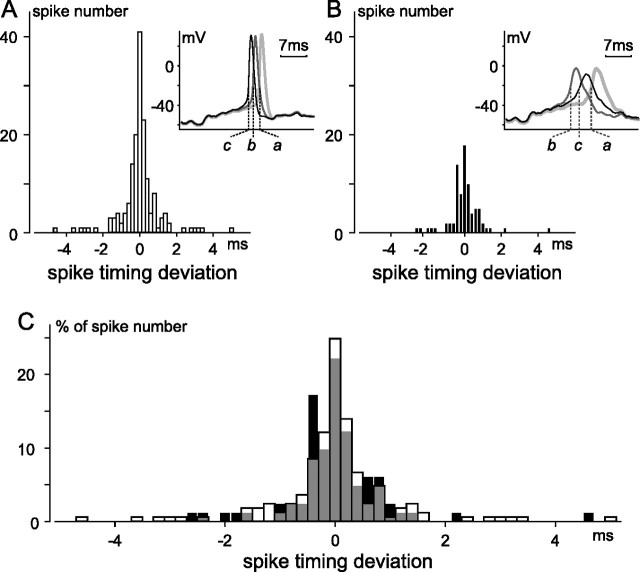
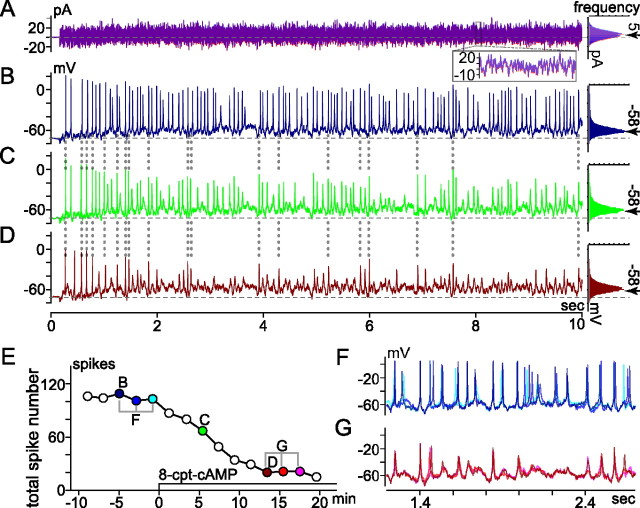
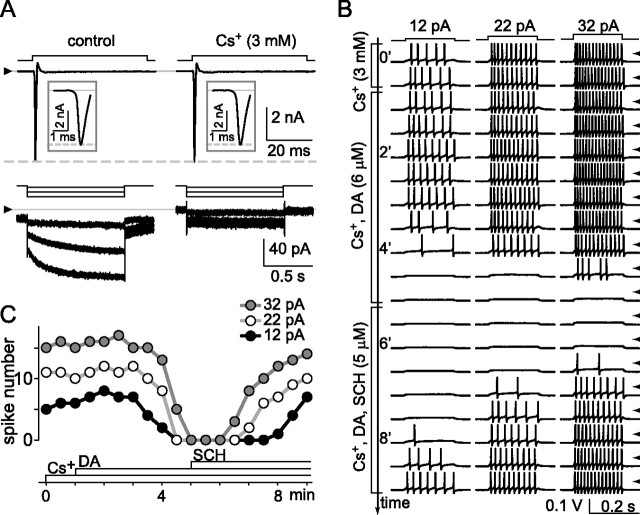
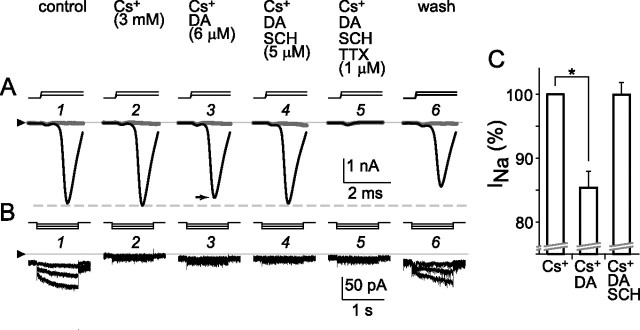
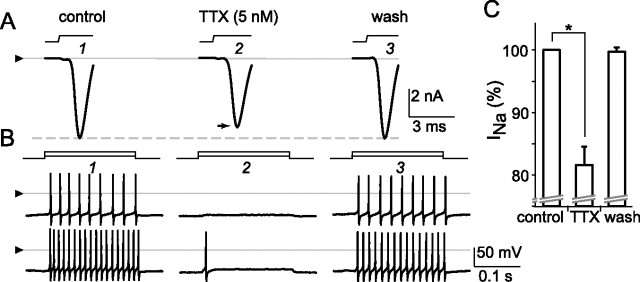
The spike output of neural pathways can be regulated by modulating output neuron excitability and/or their synaptic inputs. Dopaminergic interneurons synapse onto cells that route signals to mammalian retinal ganglion cells, but it is unknown whether dopamine can activate receptors in these ganglion cells and, if it does, how this affects their excitability. Here, we show D(1a) receptor-like immunoreactivity in ganglion cells identified in adult rats by retrogradely transported dextran, and that dopamine, D(1)-type receptor agonists, and cAMP analogs inhibit spiking in ganglion cells dissociated from adult rats. These ligands curtailed repetitive spiking during constant current injections and reduced the number and rate of rise of spikes elicited by fluctuating current injections without significantly altering the timing of the remaining spikes. Consistent with mediation by D(1)-type receptors, SCH-23390 [R-(+)-7-chloro-8-hydroxy-3-methyl-1-phenyl-2,3,4,5-tetrahydro-1H-3-benzazepine] reversed the effects of dopamine on spikes. Contrary to a recent report, spike inhibition by dopamine was not precluded by blocking I(h). Consistent with the reduced rate of spike rise, dopamine reduced voltage-gated Na(+) current (I(Na)) amplitude, and tetrodotoxin, at doses that reduced I(Na) as moderately as dopamine, also inhibited spiking. These results provide the first direct evidence that D(1)-type dopamine receptor activation can alter mammalian retinal ganglion cell excitability and demonstrate that dopamine can modulate spikes in these cells by a mechanism different from the presynaptic and postsynaptic means proposed by previous studies. To our knowledge, our results also provide the first evidence that dopamine receptor activation can reduce excitability without altering the temporal precision of spike firing.


Figures

Figure 1.
Figure 1.
Western blots of D1a dopamine receptor. Homogenate of snap-frozen retinas, and protein standards, separated by SDS-PAGE and transferred to nitrocellulose membranes. A, D, Molecular weight (MW) standard proteins, with MW of each indicated in kilodaltons by superimposed number. B, Retina proteins run alongside standard proteins in A and probed with anti-D1a receptor antibody. A well focused protein band is seen at migration distance corresponding to an estimated MW of 54 kDa. No other proteins are stained over the MW range shown (20–100 kDa). C, E, In a different experiment, retina proteins run alongside standard proteins in D. Lane C probed with anti-D1a receptor antibody that had been preincubated overnight with immunogen. Probing of lane E with anti-D1a receptor antibody shows a well focused protein band in E at an estimated MW of 54 kDa. A faint band is also seen within the MW range reported for glycosylated D1a receptors (here between 55 and 60 kDa). Staining of both bands (dark and faint) was blocked completely by immunogen (C).
Figure 2.
Figure 2.
D1a receptor-like immunoreactivity in ganglion cells in vertical sections. Ganglion cells identified by retrograde transport of Alexa Fluor 488-coupled dextran introduced into the optic nerve. Labeling with anti-D1a receptor antibody visualized with Alexa Fluor 555-conjugated secondary antibody. Images are single confocal optical sections obtained with a 40× oil-immersion objective. Fluorescence attributable to each dye obtained individually. A, Direct overlay of fluorescence signals from retrogradely transported dextran (backfill, in green) and anti-D1a receptor antibody (D1a, in red) indicate ganglion cells exhibiting D1a receptor-like immunoreactivity (orange–yellow). Labels along right side indicate position of outer nuclear layer (onl), inner nuclear layer (inl), inner plexiform layer (ipl), and ganglion cell layer (gcl). B, Example of same labeling from a different retina. Immunopositive dendrites emerge from a large soma in the right half of the panel and project into the distal half of ipl. C, Images of a section obtained under the exact same conditions as B, except that the anti-D1a receptor antibody was preincubated with immunogen before application to section. Scale bar, 25 μm (applies to all panels).
Figure 3.
Figure 3.
D1a receptor-like immunoreactivity in ganglion cells in flat-mounted retina. A, As in Figure 2, ganglion cell somata identified by retrogradely transported, fluorescein-coupled dextran (green in A, C, D). The same fluorescence identifies fibers in this image as intraretinal segments of ganglion cell axons, extending as fascicles between the top and bottom edges of A and C. B, Binding of polyclonal (Millipore Bioscience Research Reagents) anti-D1a receptor antibody visualized with Alexa Fluor 568-conjugated secondary antibody. C, Overlay of A and B. As in Figure 2, yellow/orange indicates regions of overlapping red (Alexa Fluor 568) and green (fluorescein) signal, signifying D1a receptor-like immunoreactivity in ganglion cells. D, Same field as C masked to highlight dextran-containing somata only. The arrows show some ganglion cells without noticeable D1a-like immunoreactivity. Fluorescent images A–D are maximum intensity z-projection of five consecutive optical sections obtained at 1 μm z-intervals with three-frame Kalman averaging. Scale bar: (in D) A–D, 25 μm. E, Side-by-side histograms of apparent size of ganglion cells identified by fluorescent dextran incorporation via retrograde transport (light bars) and the subset of these cells that also showed D1a-like receptor immunoreactivity (dark bars). Cells were masked, selected, and analyzed in ImageJ from five fields similar to (and including) D from three different retinas. Each ImageJ-reported cross-sectional area converted to diameter of an equivalent circle. Diameters are placed into 1 μm bins centered about the indicated values. F–H, Binding of an anti-D1a receptor antibody and an antibody directed against ganglion cell marker Brn3a. F and G are sequentially collected single optical sections of the ganglion cell layer of a retina incubated in anti-Brn3a and anti-goat DL549-conjugated secondary, and monoclonal (Novus) anti-D1a primary antibody and anti-mouse DL649-conjugated secondary, respectively. Fluorescence from the fluorophores is pseudocolored blue and green. H merges the images in F and G. The crisp green outline of each blue cell profile shows that the monoclonal anti-D1a antibody binds to many of the somata identified as ganglion cells in this field. Scale bar: (in F) F–H, 15 μm.
Figure 4.
Figure 4.
Inhibition by dopamine and by SKF-38393, and reversal of these effects by SCH-23390. A, B, Cell-attached, voltage-clamp mode at 33°C; currents appear as vertical lines because of slow time base, with downward deflections occurring at peak depolarization of each spike. Spikes elicited by stepwise changes in patch electrode voltage (5 mV in A; 10 mV in B). Solution continuously superfused over the cell by U-tube microperfusion. Spikes in control solution (left, “control”) are blocked by inclusion of 10 μm dopamine (middle). Loss of spikes is complete within 2.5 min after onset of dopamine application at lower stimulus step size, but only partial at the higher step size. Spikes are completely blocked by 5 min after dopamine first reached the recording bath. Addition of SCH-23390 (so that the superfusate contains 10 μm dopamine and 10 μm SCH) blocks the response to dopamine at both stimulus strengths. C, D, Inhibition by SKF-38393. Ruptured-patch, current-clamp mode at 34°C; 200 ms injections of constant current (10 pA in C; 30 pA in D). Solution continuously superfused over the cell by U-tube microperfusion. As in cell-attached recordings, spike firing is continuous during both stimulus pulses in control solution (left, “control”) and is inhibited during same stimulus pulses by 10 μm SKF-38393 (middle, “SKF 10 μm”). Spikes are first lost at low stimulus strength and subsequently lost at higher stimulus strength, too. SCH-23390 (i.e., perfusate containing 10 μm SKF and 10 μm SCH) blocks the response to SKF. The triangles at left show reference level for all traces in each row (zero current in A, B; zero voltage in C, D).
Figure 5.
Figure 5.
Effect of SKF-81297 on spikes elicited by fluctuating current injection; VCcCC mode recording at room temperature; perforated-patch configuration in low Ca2+ bath solution; spiking elicited by injecting fluctuating current at intervals of at least 20 s. A, Waveform of current injected (left) and histogram of current amplitude (far right). Traces of current measured at moments labeled “B” and “D” in E, and histograms constructed from these currents, are superimposed in A. Inset superimposes current recorded between 8.0 and 8.1 s of each 10 s trace. Traces from B and D are plotted in blue and red, respectively. Histograms fit to a Gaussian distribution; mean and SD are ∼3 pA (indicated by arrow) and 24 pA, respectively. B–D, Spiking and subthreshold membrane voltage changes induced by current in A, ∼4.5 min before (B), ∼6.5 min after (C), and ∼16 min after (D) SKF-81297 application began (10 μl of a 1 mm stock solution added to 0.9 ml recording bath) (see Materials and Methods). Histograms of voltages traversed during each fluctuating current injection are plotted to right. Mean voltages between and during the fluctuating current injections were set to −68 mV (dashed horizontal line through voltage traces) and −58 mV (at arrow next to each histogram), respectively. E, Time course of SKF-81297 effect on total spike number. Each point plots total number of spikes elicited by 10 s injection of fluctuating current (e.g., those in B–D are plotted in E at times labeled B–D, respectively). F, Mean ± SEM of number of spikes recorded during three injections of the current shown in A before and during the response to SFK-81297 in all cells tested (n = 6). Lines join the control and SKF values for individual cells. Bars plot the mean ± SEM of the values from all cells. The means differed significantly (*p < 0.009, paired t test). G, H, Membrane voltage changes on expanded timescale. The three traces recorded at times bracketed before SKF-81297 in E are superimposed in G; those recorded at times bracketed during SKF-81297 in E are superimposed in H. The trace and dot colors show when each recording was made and highlight the similarity in spike timing.
Figure 6.
Figure 6.
Spike timing deviation in absence and presence of SKF-81297. Spiking elicited and recorded using same methods as in Figure 5. Spike timing was compared moment-by-moment in three 10 s traces recorded ≤4 min before application of SKF-81297 (A), and in three 10 s traces recorded 12–16 min after application of SKF-81297 (B). For each condition, if spikes occurred at similar times in all three traces (i.e., if spikes were “temporally coaligned”), the difference between the time of each spike and the average of the times of the coaligned spikes was measured, and tallied accordingly in A or B. Time was measured from beginning of each current injection to moment of maximum change in slope (dV/dt) along rising phase of each spike. Histograms are binned at 0.2 ms, and include 165 (55 × 3) and 81 (27 × 3) spikes for A and B, respectively. Insets superimpose examples of spikes considered to be coaligned in traces recorded before (A) and after (B) SKF. All six traces (labeled a–c in A and in B) begin at identical times after start of each 10 s current injection. C, Percentage distribution of spike timing deviation. Spike number in A and B was normalized by respective total spike number and the two histograms were overlaid, with gray signifying overlap of the before (clear) and after SKF (filled) distributions.
Figure 7.
Figure 7.
Effect of membrane-permeant cAMP analog (8-cpt-cAMP) on spikes elicited by fluctuating current injection. Recording mode, conditions, and figure format are as in Figure 5. A, Current injected (left) and histogram of current amplitude (right). The left and right parts of A superimpose two traces recorded at B and D in E, and their corresponding amplitude histograms, respectively. The inset superimposes current recorded between 8.0 and 8.1 s of each 10 s trace. The histograms fit to a Gaussian distribution with mean and SD of ∼5 pA (arrow) and 8 pA, respectively. B–D, Spiking and subthreshold membrane voltage changes induced by current in A, ∼5 min before (B), ∼5 min after (C), and ∼13 min after (D) application of 8-cpt-cAMP began (here, 2 μl of 50 mm stock solution was added to 0.9 ml recording bath). Histograms of voltages traversed during each fluctuating current injection are plotted to right. Mean voltages between and during fluctuating current injections were set to −72 mV (dashed horizontal line through voltage traces) and −58 mV (at arrow next to each histogram), respectively. E, Time course of 8-cpt-cAMP effect on total spike number. Each point plots total number of spikes elicited by 10 s injection of fluctuating current (e.g., those in B–D are plotted at correspondingly labeled times in E). F, G, Membrane voltage on expanded timescale. Three traces recorded at times bracketed before and during 8-cpt-cAMP in E are superimposed in F and G, respectively.
Figure 8.
Figure 8.
Block of I h does not preclude spike inhibition by dopamine. Voltage-gated Na+ current, I h, and spikes elicited in a single ganglion cell in ruptured-patch configuration at 34°C. A, Currents recorded in voltage-clamp mode without leak subtraction while solution superfused over the cell were changed from control (left) to 3 mm Cs+ (right). Steps above current traces show stimulus timing and polarity. Holding potential was −72 mV. Test potentials were −47 mV to activate Na+ current (top rows) and −77, −92, −107 mV to activate I h (bottom rows). Cs+ blocks I h (including portion activated at −72 mV) (Lee and Ishida, 2007) without affecting Na+ current. The triangles at left show zero current level for each row. The insets show the Na+ current on an expanded timescale. B, Spikes then recorded in current-clamp mode in response to sequence of constant current injections (12, 22, and 32 pA) while superfusate were changed (as marked by brackets) from 3 mm Cs+ (first two rows of spikes) to 3 mm Cs+ and 6 μm dopamine (next nine rows), and then 3 mm Cs+, 6 μm dopamine, and 5 μm SCH-23390 (last eight rows). Stimulus timing is shown at top of B. Voltage traces displayed in the sequence that they were collected, with each row showing responses to same current injections, and each row initiated at 30 s intervals. Tick marks along right side show ground level for each row of traces. C plots number of spikes elicited by each current injection in B, showing inhibition of spikes by dopamine and antagonism of this response by SCH-23390.
Figure 9.
Figure 9.
Reduction of voltage-gated Na+ current by D1-type dopamine receptor activation. Ruptured-patch configuration at 34°C; voltage-clamp mode with no leak subtraction. Currents activated in a single cell by 4 ms depolarizations (A) and 1 s hyperpolarizations (B). Holding potential was −72 mV. Test potentials were −57 mV and −47 mV to activate voltage-gated Na+ current (A, gray and black traces, respectively) and −77, −92, and −107 mV to activate I h (B). Stimulus timing and polarity are shown by steps above current traces. The triangles at left show zero-current level for all traces in each row. As labeled above current traces in A, solution superfused over cell was changed from control (A1, B1) to 3 mm Cs+ (A2, B2), 6 μm dopamine and 3 mm Cs+ (A3, B3), 6 μm dopamine, 3 mm Cs+, and 5 μm SCH-23390 (A4, B4), 6 μm dopamine, 3 mm Cs+, 5 μm SCH-23390, and 1 μm TTX (A5, B5), and control (A6, B6). Peak amplitude of depolarization-activated Na+ current at −47 mV in dopamine (A3, black trace) is 10% smaller than in control (A1). This reduction was reversed by SCH-23390 (A4). The depolarization-activated current was blocked by 1 μm TTX (A5), leaving small uncompensated capacitive inward and no outward current. This TTX block, and the block of I h by Cs+, were reversed by washing with control solution (A6, B6). The activation threshold and increase in Na+ current by the increment in step depolarizations, and the increase in I h by the increment in step hyperpolarizations, were similar at the beginning and end of this recording. C, Na+ current amplitudes of all cells tested (n = 6) as in A and B. Na+ current peak amplitude normalized to value in Cs+ (left) after reduction by dopamine (middle) and recovery in SCH-23390 (right) while I h was suppressed. The mean in Cs+ differed significantly from that in Cs+ plus dopamine (*p < 0.0005, paired t test).
Figure 10.
Figure 10.
Reduction of voltage-gated Na+ current and spiking by nanomolar tetrodotoxin. Recording mode, conditions, and figure format are as in Figure 8. A, Voltage-gated Na+ current (without leak subtraction) and spikes elicited in a single ganglion cell by depolarizations in voltage- and current-clamp modes, respectively. Current activated by voltage jump from −72 to −47 mV as solution superfused over the cell is changed from control (A1) to 5 nm TTX (A2) and then control again (A3). The triangle is positioned at zero current level. The dashed horizontal line at peak of control current highlights partial reduction of current amplitude by TTX and full recovery during wash. B, Spikes then elicited in the same cell by constant current injections (10 and 30 pA) as solution superfused over the cell is changed from control (B1) to 5 nm TTX (B2) and control (B3). At this concentration, and as seen during the response to dopamine in other cells, TTX reversibly reduced peak current amplitude by 14%, raised spike threshold (viz., abolished spiking elicited by smallest current injections), and curtailed spiking elicited by larger current injections (bottom trace, middle column). The triangles are positioned at zero voltage level for all traces in each row. C plots mean (solid bar) and SEM (error bar) of peak inward current during microperfusion of control solution, TTX (4–5 nm), and after wash with control solution, for all cells tested (n = 3). The means in control and TTX differed significantly (*p < 0.0001, paired t test).

Similar articles

Cited by

References

    1. Ariano MA, Kang HC, Haugland RP, Sibley DR. Multiple fluorescent ligands for dopamine receptors. II. Visualization in neural tissues. Brain Res. 1991;547:208–222. - PubMed
    1. Bamford NS, Zhang H, Schmitz Y, Wu NP, Cepeda C, Levine MS, Schmauss C, Zakharenko SS, Zablow L, Sulzer D. Heterosynaptic dopamine neurotransmission selects sets of corticostriatal terminals. Neuron. 2004;42:653–663. - PubMed
    1. Bao S, Chan VT, Merzenich MM. Cortical remodelling induced by activity of ventral tegmental dopamine neurons. Nature. 2001;412:79–83. - PubMed
    1. Barres BA, Silverstein BE, Corey DP, Chun LL. Immunological, morphological, and electrophysiological variation among retinal ganglion cells purified by panning. Neuron. 1988;1:791–803. - PubMed
    1. Behrens UD, Wagner HJ. Localization of dopamine D1-receptors in vertebrate retinae. Neurochem Int. 1995;27:497–507. - PubMed

Publication types

MeSH terms

LinkOut - more resources