. 2010 Mar;3(2):148-58.
doi: 10.1038/mi.2009.132. Epub 2009 Nov 25.

Metagenomic analyses reveal antibiotic-induced temporal and spatial changes in intestinal microbiota with associated alterations in immune cell homeostasis

Affiliations

Metagenomic analyses reveal antibiotic-induced temporal and spatial changes in intestinal microbiota with associated alterations in immune cell homeostasis

D A Hill et al. Mucosal Immunol. 2010 Mar.

Abstract

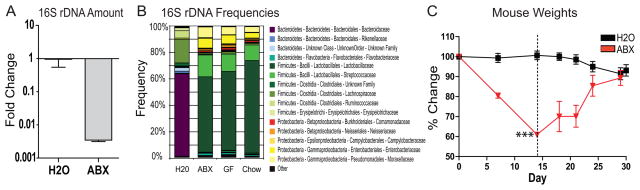
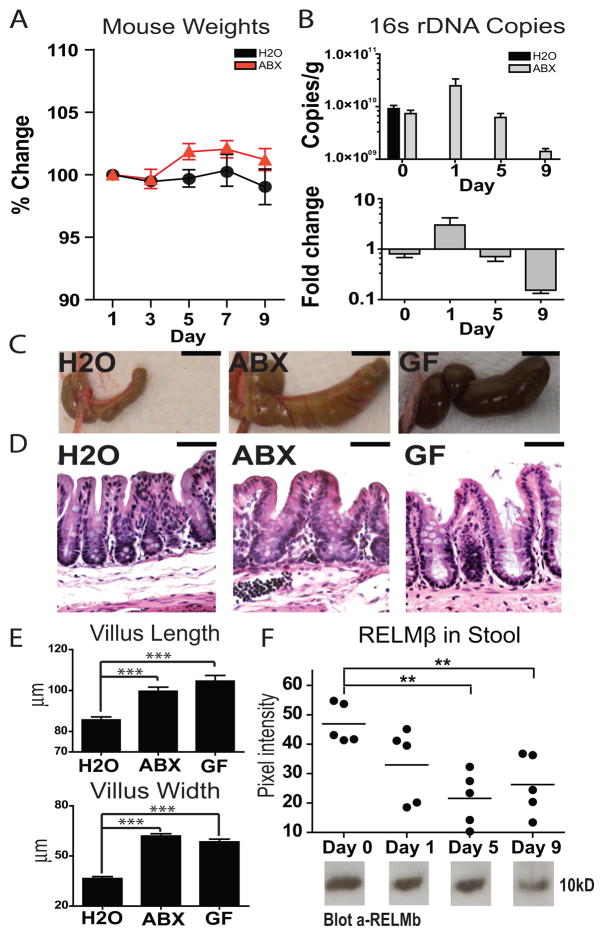
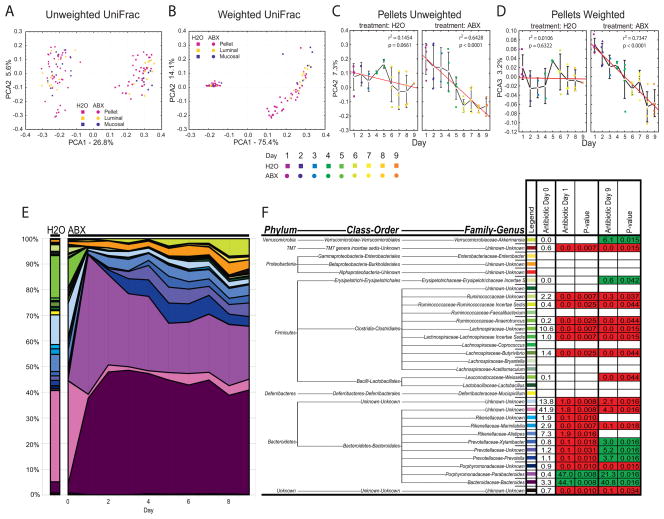
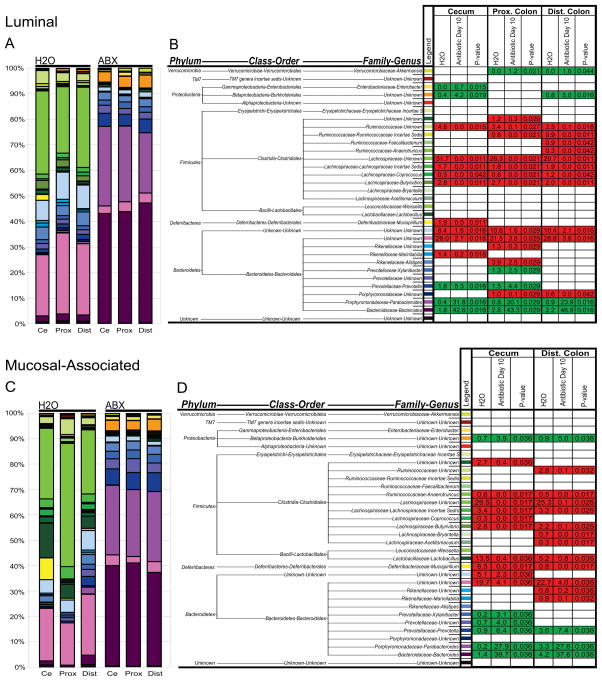
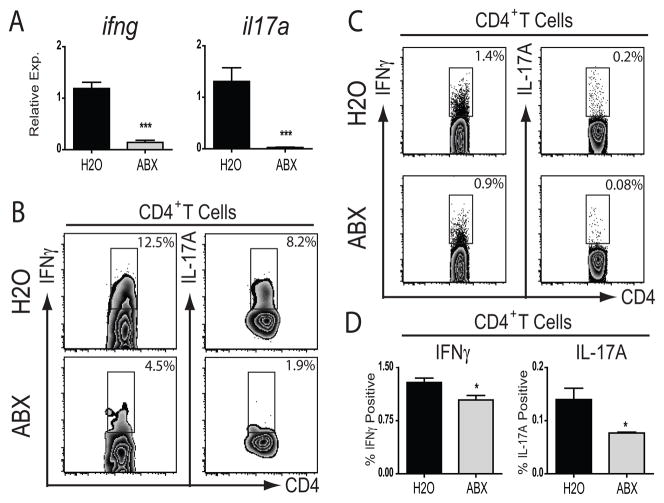
Despite widespread use of antibiotics, few studies have measured their effects on the burden or diversity of bacteria in the mammalian intestine. We developed an oral antibiotic treatment protocol and characterized its effects on murine intestinal bacterial communities and immune cell homeostasis. Antibiotic administration resulted in a 10-fold reduction in the amount of intestinal bacteria present and sequencing of 16S rDNA segments revealed significant temporal and spatial effects on luminal and mucosal-associated communities including reductions in luminal Firmicutes and mucosal-associated Lactobacillus species, and persistence of bacteria belonging to the Bacteroidetes and Proteobacteria phyla. Concurrently, antibiotic administration resulted in reduced RELM beta production, and reduced production of interferon-gamma and interleukin-17A by mucosal CD4(+) T lymphocytes. This comprehensive temporal and spatial metagenomic analyses will provide a resource and framework to test the influence of bacterial communities in murine models of human disease.


Figures

Figure 1
Figure 1
Antibiotic delivery in drinking water modulates intestinal communities but results in animal dehydration. A) 16S rDNA gene copies as quantified by real-time RT-PCR from stool pellets collected from naïve (H2O; N=5) or antibiotic-treated (ABX; N=5) animals (± s.e.m). B) Family level phylogenetic classification of 16S rDNA frequencies in stool pellets collected from naïve animals (H2O; N=5), antibiotic-treated animals (ABX; N=5), germ-free animals (GF; N=3), or autoclaved animal food (Chow; N=3). C) Weights of animals fed unsupplemented (H2O; N=4) or antibiotic supplemented (ABX; N=4) water (***, p<0.001; ± s.e.m). Antibiotic-treated animals were switched to unsupplemented water at day 14 (dashed line).
Figure 2
Figure 2
Antibiotic administration by gavage mimics molecular, anatomic, histologic, and immunologic characteristics of reduced microbial stimulation without animal dehydration. A) Weights of animals gavaged with unsupplemented (H2O; N=4) or antibiotic-supplemented (ABX; N=5) water (± s.e.m). B) 16S rDNA gene copies as quantified from stool pellets collected before (day 0) or over the course of antibiotic treatment (days 1, 5, 9) (N=5; ± s.e.m). C) Cecal images from control-treated (H2O), day 10 antibiotic-treated (ABX), or germ-free animals (GF) (bar, 1 cm). D) Photomicrographs of H&E stained cecal sections from control-treated (H2O), day 10 antibiotic-treated (ABX), or germ-free animals (GF) showing expansion of the lamina propria and enterocyte hyperplasia in ceca from antibiotic-treated and germ-free animals (bar, 50 μm). E) Quantification of cecal villus length and width from control-treated (H2O; N=4), day 10 antibiotic-treated (ABX; N=5), or germ-free animals (GF; N=3) (***, p<0.001; ± s.e.m). F) Quantification of RELMβ protein in stool pellets by western blot over the course of antibiotic treatment (N=5) (**, p 0.01; ± s.e.m).
Figure 3
Figure 3
Global restructuring of intestinal bacterial communities over time. A) Unweighted or B) weighted UniFrac analysis of stool pellet, luminal content, and mucosal-associated samples from control-treated or antibiotic-treated animals. C) Unweighted or D) weighted UniFrac analysis of stool pellet samples from control-treated (H2O; N=4) or antibiotic-treated (ABX; N=5) animals from day 1 to day 9 post treatment initiation. Colored symbols represent treatment day, white squares represent means, red line represents linear regression analysis (± s.e.m, significance determined by regression analysis). E) Genus level phylogenetic classification of 16S rDNA frequencies in stool pellets collected from control-treated (H2O; N=4) or antibiotic-treated (ABX; N=5) animals from day 0 to day 9. F) Average frequency of bacterial groups before (Antibiotic Day 0) or during (Antibiotic Day 1, 9) antibiotic treatment. Mann-Whitney P-values of changes in group frequency with antibiotic treatment. Frequency reductions upon antibiotic treatment in red, increases in green, non-significant changes blank.
Figure 4
Figure 4
Antibiotics modify luminal and mucosal-associated bacterial communities along the length of the colon. A) Genus level phylogenetic classification of 16S rDNA frequencies in luminal samples collected from control-treated (H2O; N=4) or day 10 antibiotic-treated (ABX; N=5) animals from the cecum (Ce), proximal colon (Prox), or distal colon (Dist). B) Average frequency of bacterial groups in samples from control-treated (H2O; N=4) or antibiotic-treated (Antibiotic Day 10; N=5) animals. C) Genus level phylogenetic classification of 16S rDNA frequencies in mucosal-associated samples collected from control-treated (H2O; N=4) or day 10 antibiotic-treated (ABX; N=5) animals from the cecum (Ce), proximal colon (Prox), or distal colon (Dist). D) Average frequency of bacterial groups in mucosal-associated samples from control-treated (H2O; N=4) or antibiotic-treated (Antibiotic Day 10; N=5) animals. Mann-Whitney P-values of changes in group frequency with antibiotic treatment. Frequency reductions upon antibiotic treatment in red, increases in green, non-significant changes blank.
Figure 5
Figure 5
Antibiotic treatment alters mucosal CD4+ T lymphocyte homeostasis. A) Cytokine mRNA expression on day 10 as assessed by real-time RT-PCR of small intestine samples from control-treated (H2O; N=4) or antibiotic-treated (ABX; N=5) animals (***, p<0.001; ± s.e.m). B) Expression of IFNγ or IL-17A by CD4+ T lymphocytes in the small intestinal lamina propria of control-treated (H2O) or day 10 antibiotic-treated (ABX) animals as analyzed by flow cytometry. C) Expression of IFNγ or IL-17A by CD4+ T lymphocytes in the mesenteric lymph nodes of control-treated (H2O) or day 10 antibiotic-treated (ABX) animals analyzed by flow cytometry. D) Statistical analysis of mesenteric lymph node CD4+ T lymphocyte cytokine expression from control-treated (H2O; N=4) or antibiotic-treated (ABX; N=5) animals (*, p<0.05; ± s.e.m).

Similar articles

Cited by

References

    1. Eckburg PB, Lepp PW, Relman DA. Archaea and their potential role in human disease. Infect Immun. 2003;71:591–596. - PMC - PubMed
    1. Whitman WB, Coleman DC, Wiebe WJ. Prokaryotes: the unseen majority. Proc Natl Acad Sci U S A. 1998;95:6578–6583. - PMC - PubMed
    1. Ley RE, Peterson DA, Gordon JI. Ecological and evolutionary forces shaping microbial diversity in the human intestine. Cell. 2006;124:837–848. - PubMed
    1. Pace NR, Olsen GJ, Woese CR. Ribosomal RNA phylogeny and the primary lines of evolutionary descent. Cell. 1986;45:325–326. - PubMed
    1. Eckburg PB, et al. Diversity of the human intestinal microbial flora. Science. 2005;308:1635–1638. - PMC - PubMed

Publication types

Substances