

Decreased number of parvalbumin and cholinergic interneurons in the striatum of individuals with Tourette syndrome
- PMID: 19941350
- PMCID: PMC2846837
- DOI: 10.1002/cne.22206
Decreased number of parvalbumin and cholinergic interneurons in the striatum of individuals with Tourette syndrome
Abstract
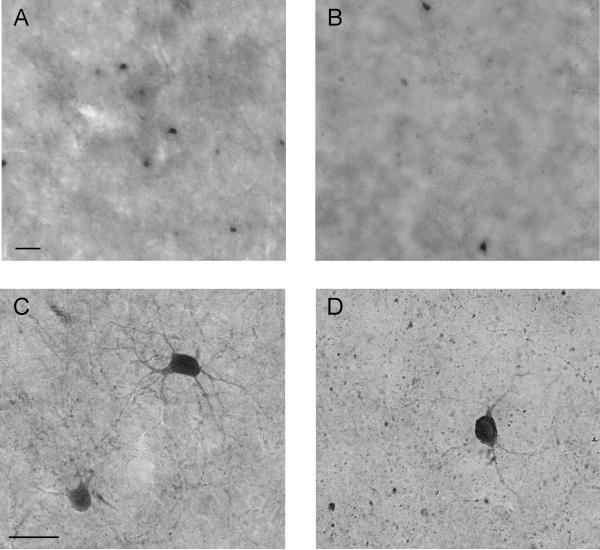
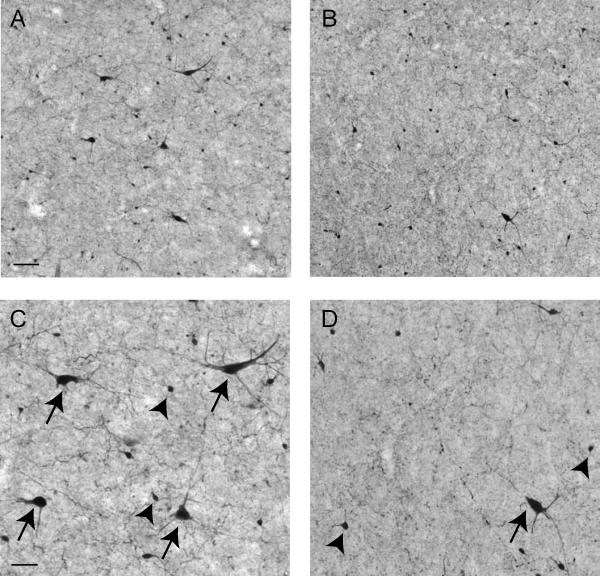
Corticobasal ganglia neuronal ensembles bring automatic motor skills into voluntary control and integrate them into ongoing motor behavior. A 5% decrease in caudate (Cd) nucleus volume is the most consistent structural finding in the brain of patients with Tourette syndrome (TS), but the cellular abnormalities that underlie this decrease in volume are unclear. In this study the density of different types of interneurons and medium spiny neurons (MSNs) in the striatum was assessed in the postmortem brains of 5 TS subjects as compared with normal controls (NC) by unbiased stereological analyses. TS patients demonstrated a 50%-60% decrease of both parvalbumin (PV)+ and choline acetyltransferase (ChAT)+ cholinergic interneurons in the Cd and the putamen (Pt). Cholinergic interneurons were decreased in TS patients in the associative and sensorimotor regions but not in the limbic regions of the striatum, such that the normal gradient in density of cholinergic cells (highest in associative regions, intermediate in sensorimotor and lowest in limbic regions) was abolished. No significant difference was present in the densities of medium-sized calretinin (CR)+ interneurons, MSNs, and total neurons. The selective deficit of PV+ and cholinergic striatal interneurons in TS subjects may result in an impaired cortico/thalamic control of striatal neuron firing in TS.
Figures


Similar articles
-
Targeted ablation of cholinergic interneurons in the dorsolateral striatum produces behavioral manifestations of Tourette syndrome.Proc Natl Acad Sci U S A. 2015 Jan 20;112(3):893-8. doi: 10.1073/pnas.1419533112. Epub 2015 Jan 5. Proc Natl Acad Sci U S A. 2015. PMID: 25561540 Free PMC article.
-
Altered parvalbumin-positive neuron distribution in basal ganglia of individuals with Tourette syndrome.Proc Natl Acad Sci U S A. 2005 Sep 13;102(37):13307-12. doi: 10.1073/pnas.0502624102. Epub 2005 Aug 30. Proc Natl Acad Sci U S A. 2005. PMID: 16131542 Free PMC article.
-
Distribution of GABAergic interneurons and dopaminergic cells in the functional territories of the human striatum.PLoS One. 2012;7(1):e30504. doi: 10.1371/journal.pone.0030504. Epub 2012 Jan 17. PLoS One. 2012. PMID: 22272358 Free PMC article.
-
The calretinin interneurons of the striatum: comparisons between rodents and primates under normal and pathological conditions.J Neural Transm (Vienna). 2018 Mar;125(3):279-290. doi: 10.1007/s00702-017-1687-x. Epub 2017 Feb 6. J Neural Transm (Vienna). 2018. PMID: 28168621 Review.
-
Cholinergic interneuron characteristics and nicotinic properties in the striatum.J Neurobiol. 2002 Dec;53(4):590-605. doi: 10.1002/neu.10150. J Neurobiol. 2002. PMID: 12436423 Review.
Cited by
-
Probing striatal microcircuitry to understand the functional role of cholinergic interneurons.Mov Disord. 2015 Sep;30(10):1306-18. doi: 10.1002/mds.26340. Epub 2015 Jul 30. Mov Disord. 2015. PMID: 26227561 Free PMC article. Review. No abstract available.
-
What is new in tics, dystonia and chorea?Clin Med (Lond). 2016 Aug;16(4):383-9. doi: 10.7861/clinmedicine.16-4-383. Clin Med (Lond). 2016. PMID: 27481387 Free PMC article. Review.
-
Update: studies of prepulse inhibition of startle, with particular relevance to the pathophysiology or treatment of Tourette Syndrome.Neurosci Biobehav Rev. 2013 Jul;37(6):1150-6. doi: 10.1016/j.neubiorev.2012.09.002. Epub 2012 Sep 24. Neurosci Biobehav Rev. 2013. PMID: 23017868 Free PMC article. Review.
-
The implication of neuroactive steroids in Tourette's syndrome pathogenesis: A role for 5α-reductase?J Neuroendocrinol. 2013 Nov;25(11):1196-208. doi: 10.1111/jne.12066. J Neuroendocrinol. 2013. PMID: 23795653 Free PMC article. Review.
-
Distinct patterns of GABAergic interneuron pathology in autism are associated with intellectual impairment and stereotypic behaviors.Autism. 2023 Aug;27(6):1730-1745. doi: 10.1177/13623613231154053. Epub 2023 Mar 19. Autism. 2023. PMID: 36935610 Free PMC article.
References
-
- Albin RL, Koeppe RA, Bohnen NI, Nichols TE, Meyer P, Wernette K, Minoshima S, Kilbourn MR, Frey KA. Increased ventral striatal monoaminergic innervation in Tourette syndrome. Neurology. 2003;61(3):310–315. - PubMed
-
- Albin RL, Young AB, Penney JB. The functional anatomy of disorders of the basal ganglia. Trends Neurosci. 1995;18(2):63–64. - PubMed
-
- Bajwa RJ, de Lotbiniere AJ, King RA, Jabbari B, Quatrano S, Kunze K, Scahill L, Leckman JF. Deep brain stimulation in Tourette's syndrome. Mov Disord. 2007;22(9):1346–1350. - PubMed
-
- Berke JD, Okatan M, Skurski J, Eichenbaum HB. Oscillatory entrainment of striatal neurons in freely moving rats. Neuron. 2004;43(6):883–896. - PubMed
Publication types
MeSH terms
Substances
Grants and funding
LinkOut - more resources
Full Text Sources
Other Literature Sources
Medical
