. 2009 Nov 26:7:82.
doi: 10.1186/1741-7007-7-82.

Have giant lobelias evolved several times independently? Life form shifts and historical biogeography of the cosmopolitan and highly diverse subfamily Lobelioideae (Campanulaceae)

Affiliations

Have giant lobelias evolved several times independently? Life form shifts and historical biogeography of the cosmopolitan and highly diverse subfamily Lobelioideae (Campanulaceae)

Alexandre Antonelli. BMC Biol. .

Abstract

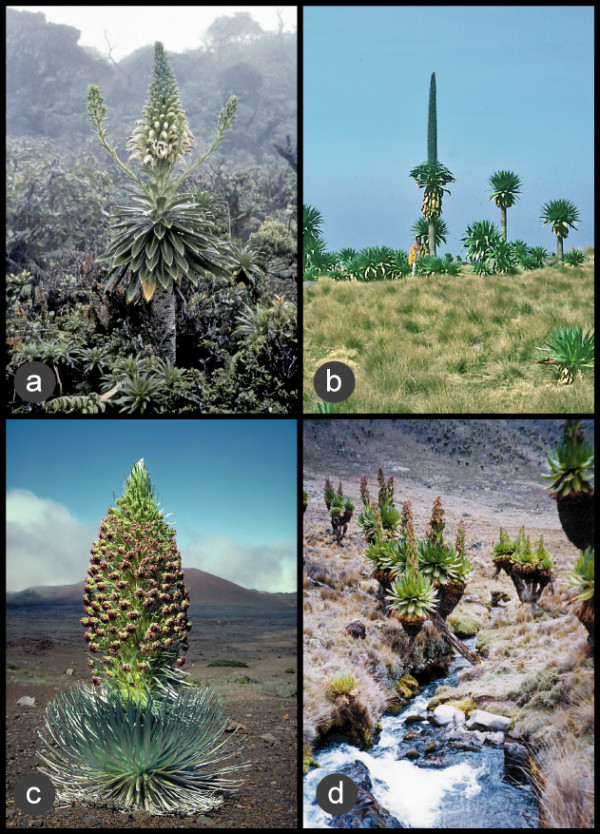
Background: The tendency of animals and plants to independently develop similar features under similar evolutionary pressures - convergence - is a widespread phenomenon in nature. In plants, convergence has been suggested to explain the striking similarity in life form between the giant lobelioids (Campanulaceae, the bellflower family) of Africa and the Hawaiian Islands. Under this assumption these plants would have developed the giant habit from herbaceous ancestors independently, in much the same way as has been suggested for the giant senecios of Africa and the silversword alliance of Hawaii.

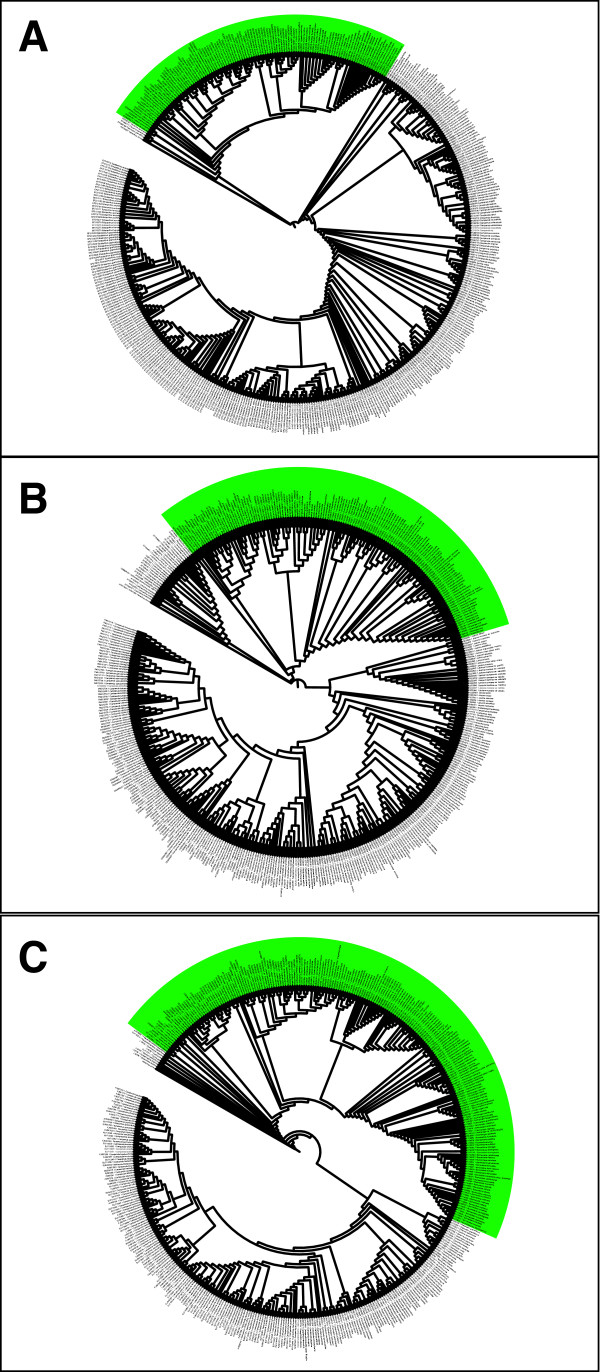
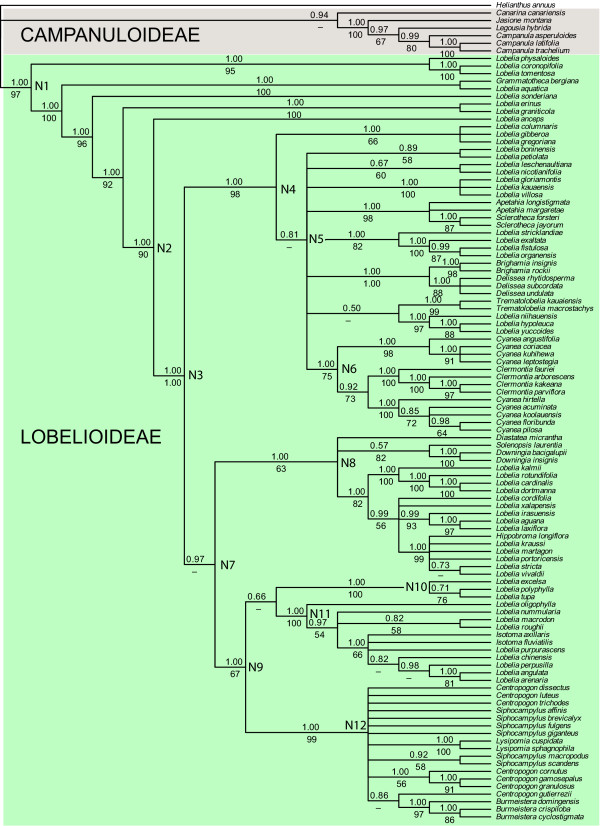
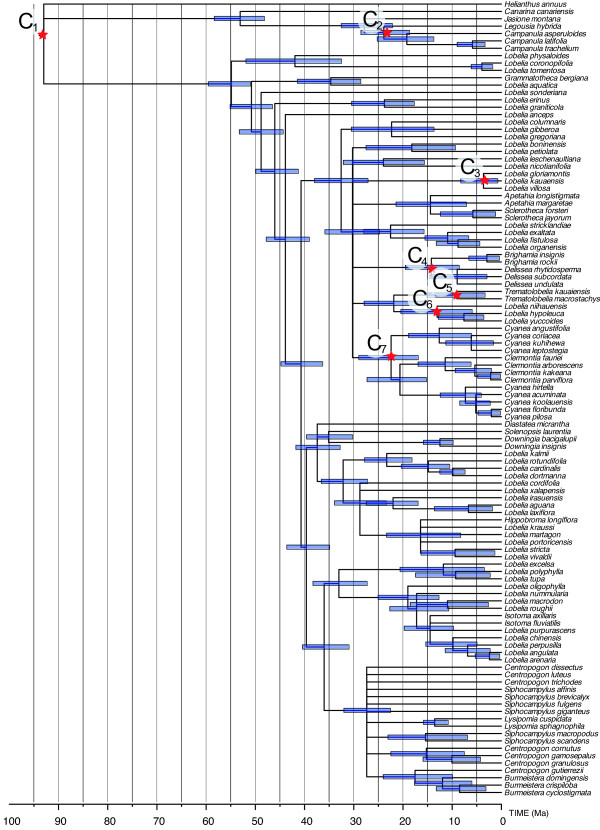
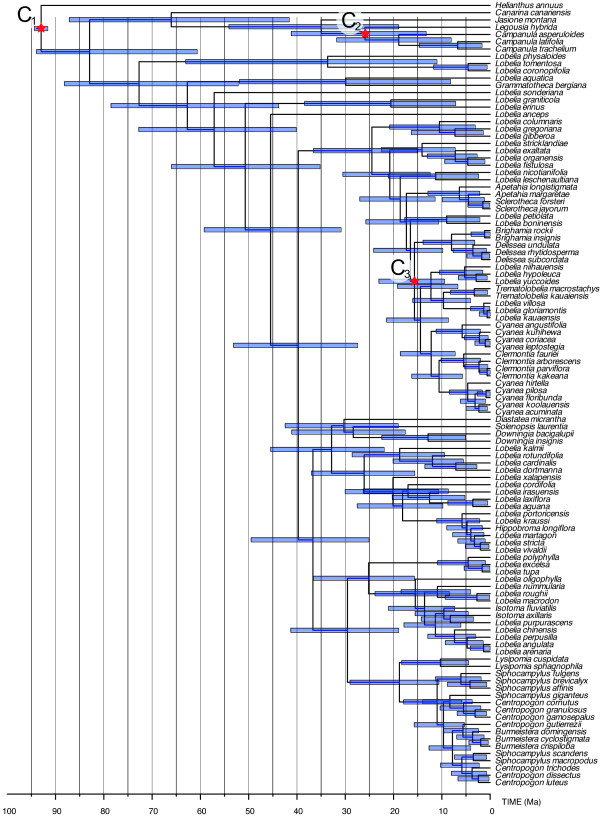
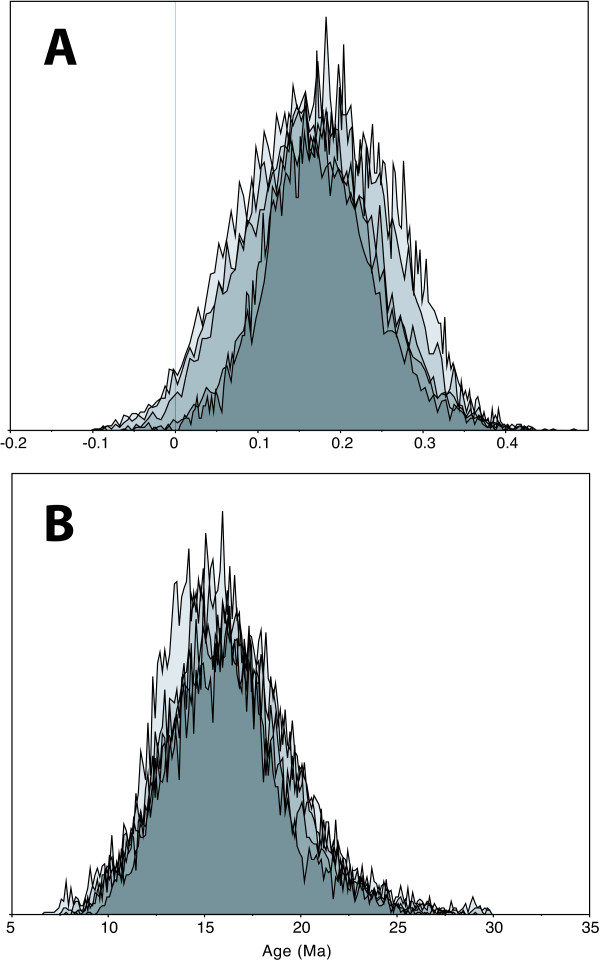
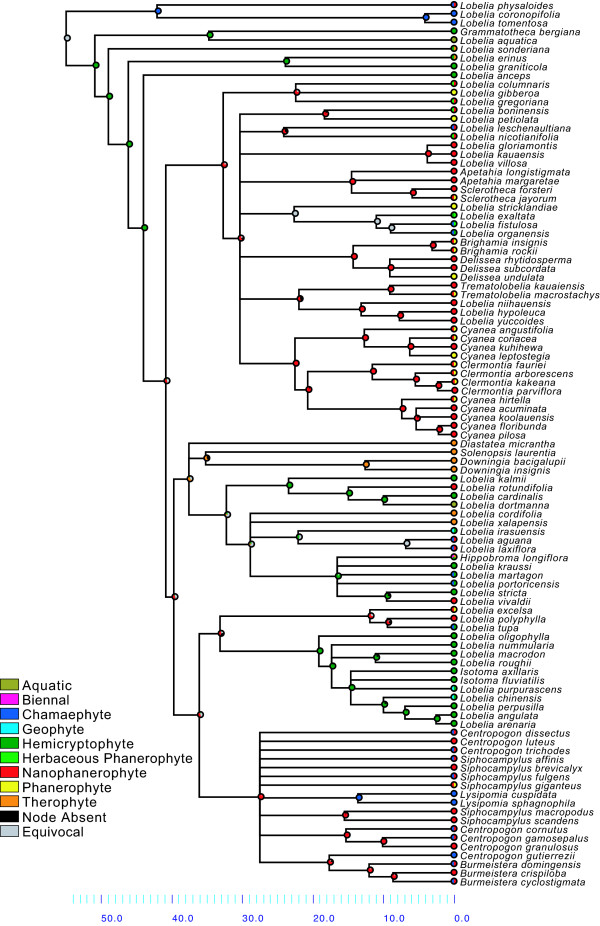
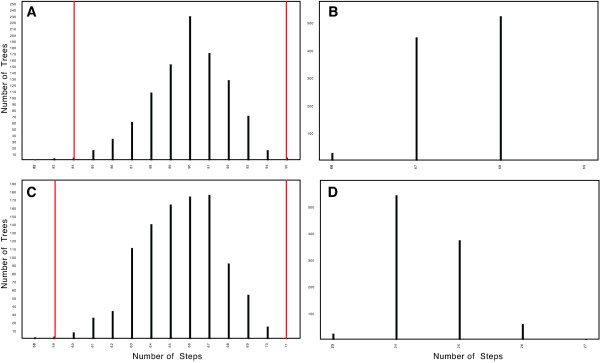
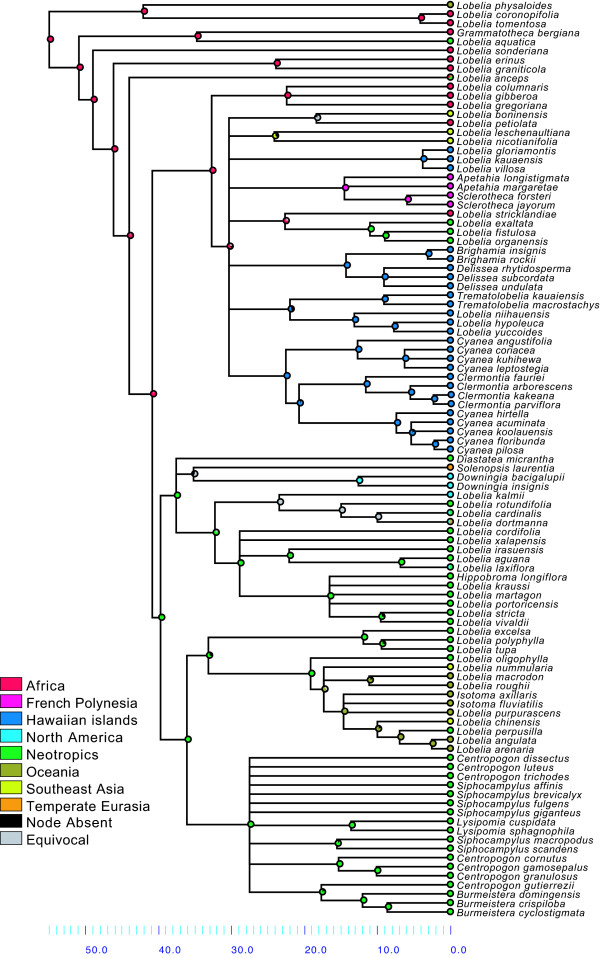
Results: Phylogenetic analyses based on plastid (rbcL, trnL-F) and nuclear (internal transcribed spacer [ITS]) DNA sequences for 101 species in subfamily Lobelioideae demonstrate that the large lobelioids from eastern Africa the Hawaiian Islands, and also South America, French Polynesia and southeast Asia, form a strongly supported monophyletic group. Ancestral state reconstructions of life form and distribution, taking into account phylogenetic uncertainty, indicate their descent from a woody ancestor that was probably confined to Africa. Molecular dating analyses using Penalized Likelihood and Bayesian relaxed clock approaches, and combining multiple calibration points, estimate their first diversification at approximately 25-33 million years ago (Ma), shortly followed by several long-distance dispersal events that resulted in the current pantropical distribution.

Conclusion: These results confidently show that lobelioid species, commonly called 'giant', are very closely related and have not developed their giant form from herbaceous ancestors independently. This study, which includes the hitherto largest taxon sampling for subfamily Lobelioideae, highlights the need for a broad phylogenetic framework for testing assumptions about morphological development in general, and convergent evolution in particular.


Figures

Figure 1
Figure 1
Same life form, same history? Giant lobelioids (Campanulaceae: Lobelioideae) from the Hawaiian Islands (a) have been suggested to have converged into the giant life form independently from the giant lobelias of Africa (b), in much the same way as the silversword alliance of Hawaii (c) and the giant senecios of Africa (d) in family Asteraceae. [Credits: a, Lobelia gloria-montis by Frederick R. Warshauer; b, Lobelia rhynchopetalum by Christian Puff; c, Argyroxiphium sandwicense by Gerald D. Carr; d, Dendrosenecio keniodendron, from http://www.wikipedia.org].
Figure 2
Figure 2
Maximum Likelihood trees of the Campanulaceae. Cladograms with the highest likelihood scores yielded from 10 independent runs in the software GARLI, based on: (a) trnL-F, 452 sequences; (b) ITS, 445 sequences; and (c) rbcL, 438 sequences. Subfamily Lobelioideae is highlighted in green. GenBank accession numbers are given following the species names (as stored in GenBank).
Figure 3
Figure 3
Phylogeny of subfamily Lobelioideae. Fifty-percent majority-rule consensus cladogram from the Bayesian analysis based on the combined data set (trnL-F, ITS, rbcL). Numbers above branches indicate Bayesian posterior probabilities; numbers below branches represent bootstrap support values (> 50) calculated under maximum parsimony. Key nodes discussed in the text are labelled N1--N12.
Figure 4
Figure 4
Divergence time estimates using Penalized Likelihood. Mean age chronogram showing 95% confidence intervals of age nodes (bars), based on 1000 Bayesian trees from a post burn-in tree sample. The stars represent calibration points: C1, crown age of Asterales as estimated by Bremer et al. [66], fixed age = 93 Ma; C2, crown age of subfamily Campanuloideae, based on a fossil Campanula, minimal age = 5.33 Ma [68]; C3 -- C7, diversification of Hawaiian taxa, corresponding to the age of the oldest island of the Hawaiian Ridge (Kure) after which a continuous chain of islands has been available as 'stepping stones' for propagules of the Hawaiian biota, maximum age = 29.8 Ma [26].
Figure 5
Figure 5
Divergence time estimates using Bayesian relaxed clock (BEAST). Tree, with the maximum sum of clade credibilities and branch lengths equal to the median ages as calculated from 40,000 post burn-in chronograms. Bars show 95% Highest Posterior Density intervals of age nodes. Calibration points as in the previous figure, with the following exceptions: (i) that the tree prior incorporated for the root of the tree (C1, 93 Ma) was not constrained a priori on a particular clade, but allowed to be calculated in the phylogenetic and dating estimation; and (ii) that all Hawaiian species were constrained as monophyletic prior to the analysis, following the results by Givnish et al. [10] (see Methods).
Figure 6
Figure 6
Selected statistics from the BEAST analysis. Distribution curves obtained from a post burn-in sample of 40,000 chronograms; each curve represents an independent run. (a) Covariance between parent and child branch rates. A value close to zero indicates that there is no support for autocorrelation (a main assumption in Penalized Likelihood analyses), meaning that the BEAST results here are probably more realistic. (b) Distribution of age estimates for the crown group of the Hawaiian taxa.
Figure 7
Figure 7
Life form shifts in relation to time. Results from character state reconstructions in subfamily Lobelioideae. The pie charts on each node show the relative proportion of character assignments based on the individual results from the Fitch optimization of 1000 Bayesian post burn-in trees, counting uniquely best states. States of extant species are shown before each species name. Results plotted on the mean age chronogram obtained using Penalized Likelihood (Figure 4). See Table 2 for a definition of life forms.
Figure 8
Figure 8
Tests of phylogenetic conservatism in life form and geographic distribution. Comparison of the minimal number of steps required to reconstruct life form and geographic distribution on a sample of 1000 simulated trees (generated by keeping the tree topology as in the Bayesian consensus, but randomly shuffling character states) with 1000 empirical trees (randomly chosen from the post burn-in Bayesian sample). (a) Simulated results for life form; (b) empirical results for life form; (c) simulated results for geographic distribution; and (d) empirical results for geographic distribution. For both characters, the observed values fall outside the lower percentiles of the simulated curves (indicated by the red lines in (a) and (c); P < 0.001), indicating that both life form and geographic distribution are phylogenetically conservative.
Figure 9
Figure 9
Ancestral range evolution in relation to time. Results from ancestral range reconstructions in subfamily Lobelioideae. Methodology as in Figure 7.
Figure 10
Figure 10
Tiny seeds crossing long distances. Lobelioid seeds are extremely small and could presumably be carried over large distances by strong wind currents. The figure shows seeds from the Hawaiian endemic Clermontia kakeana around the eye of a needle; one gram contains about 36,000 seeds.
Figure 11
Figure 11
Large habit attained elsewhere. Although truly giant lobelioids (with a thick stem and a large terminal leaf rosette) all belong to the same clade, some Neotropical species in the genera Siphocampylus, Centropogon and Burmeistera can be rather tall shrubs. The Andean Siphocampylus giganteus portrayed here is one example which has been coded as varying between nanophanerophyte and phanerophyte. [Credit: Lennart Andersson].

References

    1. Linnaeus C. Systema Naturae. 10. Vol. 1. Laurentii Salvii, Holmiae; 1758. p. 824.
    1. Givnish TJ, Sytsma KJ. Molecular Evolution and Adaptive Radiation. Cambridge: Cambridge University Press; 1997. - PubMed
    1. Futuyma DJ, Edwards SV, John R. Evolution. Massachusetts: Sinauer Associates; 2005.
    1. Hedberg O. Features of afroalpine plant ecology. Stockholm: Almqvist & Wiksell; 1964.
    1. Fries RE, Fries TCE. Die riesen-lobelien Africas. Svensk Botanisk Tidskrift. 1922;16:383–416.

Publication types

LinkOut - more resources