

Low-frequency BOLD fluctuations demonstrate altered thalamocortical connectivity in diabetic neuropathic pain
- PMID: 19941658
- PMCID: PMC2789078
- DOI: 10.1186/1471-2202-10-138
Low-frequency BOLD fluctuations demonstrate altered thalamocortical connectivity in diabetic neuropathic pain
Abstract
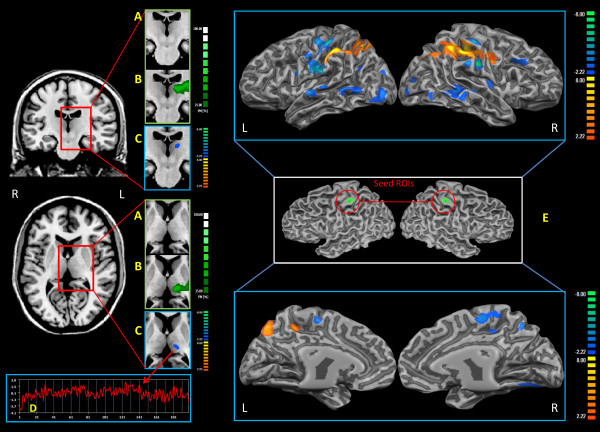
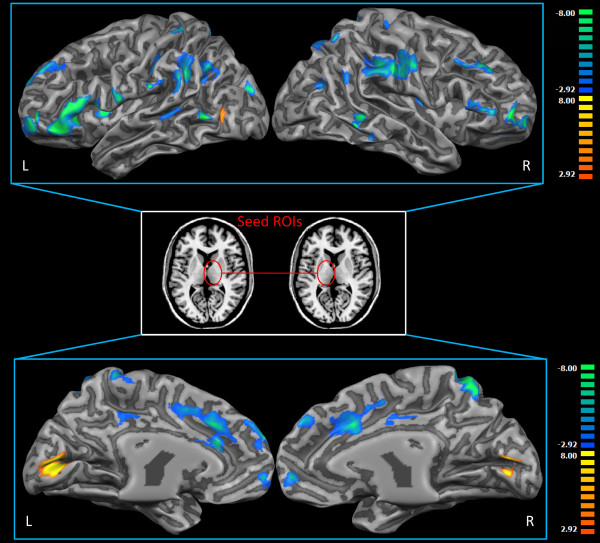
Background: In this paper we explored thalamocortical functional connectivity in a group of eight patients suffering from peripheral neuropathic pain (diabetic pain), and compared it with that of a group of healthy subjects. We hypothesized that functional interconnections between the thalamus and cortex can be altered after years of ongoing chronic neuropathic pain.
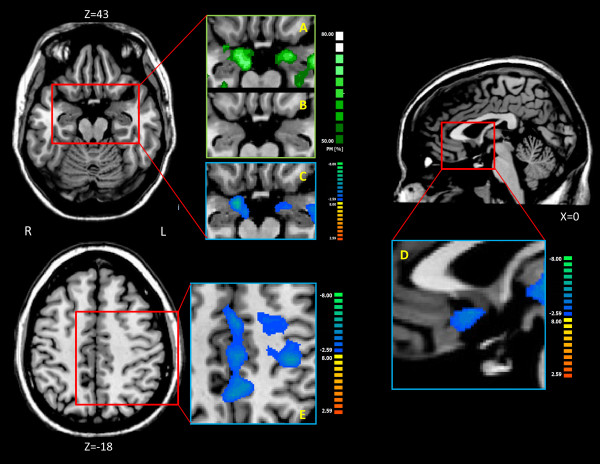
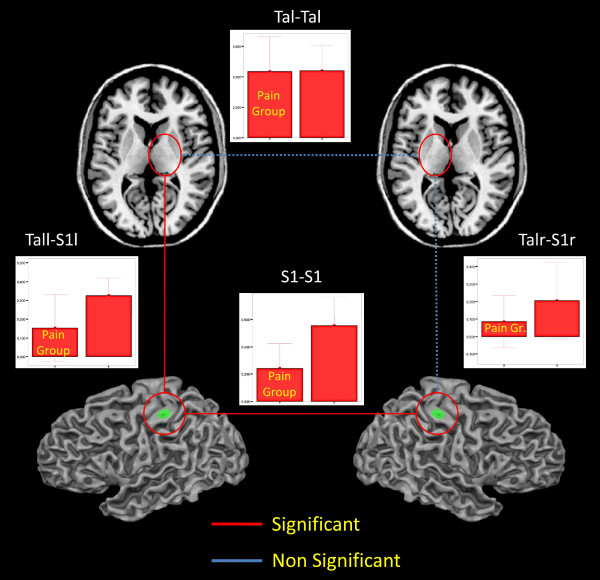
Results: Functional connectivity was studied through a resting state functional magnetic resonance imaging (fMRI) paradigm: temporal correlations between predefined regions of interest (primary somatosensory cortex, ventral posterior lateral thalamic nucleus, medial dorsal thalamic nucleus) and the rest of the brain were systematically investigated. The patient group showed decreased resting state functional connectivity between the thalamus and the cortex.
Conclusion: This supports the idea that chronic pain can alter thalamocortical connections causing a disruption of thalamic feedback, and the view of chronic pain as a thalamocortical dysrhythmia.
Figures
Similar articles
-
Low-frequency BOLD fluctuations demonstrate altered thalamocortical connectivity in schizophrenia.Schizophr Bull. 2010 Jul;36(4):713-22. doi: 10.1093/schbul/sbn145. Epub 2008 Nov 5. Schizophr Bull. 2010. PMID: 18990709 Free PMC article.
-
Thalamocortical dysconnectivity in schizophrenia.Am J Psychiatry. 2012 Oct;169(10):1092-9. doi: 10.1176/appi.ajp.2012.12010056. Am J Psychiatry. 2012. PMID: 23032387 Free PMC article.
-
Thalamocortical functional connectivity in Lennox-Gastaut syndrome is abnormally enhanced in executive-control and default-mode networks.Epilepsia. 2017 Dec;58(12):2085-2097. doi: 10.1111/epi.13932. Epub 2017 Nov 3. Epilepsia. 2017. PMID: 29098688
-
Review of thalamocortical resting-state fMRI studies in schizophrenia.Schizophr Res. 2017 Feb;180:58-63. doi: 10.1016/j.schres.2016.08.005. Epub 2016 Aug 13. Schizophr Res. 2017. PMID: 27531067 Free PMC article. Review.
-
Neuronal nociceptive responses in thalamocortical pathways.Neurosci Bull. 2009 Oct;25(5):289-95. doi: 10.1007/s12264-009-0908-1. Neurosci Bull. 2009. PMID: 19784084 Free PMC article. Review.
Cited by
-
Cortical astrocytes rewire somatosensory cortical circuits for peripheral neuropathic pain.J Clin Invest. 2016 May 2;126(5):1983-97. doi: 10.1172/JCI82859. Epub 2016 Apr 11. J Clin Invest. 2016. PMID: 27064281 Free PMC article.
-
Diabetic neuropathy.Nat Rev Dis Primers. 2019 Jun 13;5(1):42. doi: 10.1038/s41572-019-0097-9. Nat Rev Dis Primers. 2019. PMID: 31197183 Free PMC article.
-
How close are we in utilizing functional neuroimaging in routine clinical diagnosis of neuropathic pain?Curr Pain Headache Rep. 2011 Jun;15(3):223-9. doi: 10.1007/s11916-011-0187-1. Curr Pain Headache Rep. 2011. PMID: 21369853 Review.
-
Intrinsic functional connectivity of the periaqueductal gray, a resting fMRI study.Behav Brain Res. 2010 Aug 25;211(2):215-9. doi: 10.1016/j.bbr.2010.03.042. Epub 2010 Mar 27. Behav Brain Res. 2010. PMID: 20347878 Free PMC article.
-
Frequency shifts in the anterior default mode network and the salience network in chronic pain disorder.BMC Psychiatry. 2013 Mar 13;13:84. doi: 10.1186/1471-244X-13-84. BMC Psychiatry. 2013. PMID: 23497482 Free PMC article.
References
Publication types
MeSH terms
LinkOut - more resources
Full Text Sources
Other Literature Sources
Medical
