

Blood profile holds clues to role of infection in a premonitory state for idiopathic parkinsonism and of gastrointestinal infection in established disease
- PMID: 19941660
- PMCID: PMC2795757
- DOI: 10.1186/1757-4749-1-20
Blood profile holds clues to role of infection in a premonitory state for idiopathic parkinsonism and of gastrointestinal infection in established disease
Abstract
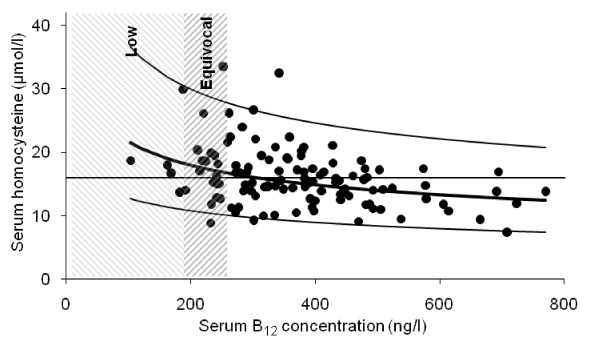
The two-stage neuroinflammatory process, containment and progression, proposed to underlie neurodegeneration may predicate on systemic inflammation arising from the gastrointestinal tract. Helicobacter infection has been described as one switch in the pathogenic-circuitry of idiopathic parkinsonism (IP): eradication modifies disease progression and marked deterioration accompanies eradication-failure. Moreover, serum Helicobacter-antibody-profile predicts presence, severity and progression of IP. Slow gastrointestinal-transit precedes IP-diagnosis and becomes increasingly-apparent after, predisposing to small-intestinal bacterial-overgrowth (SIBO). Although IP is well-described as a systemic illness with a long prodrome, there has been no comprehensive overview of the blood profile. Here, it is examined in relation to Helicobacter status and lactulose-hydrogen-breath-testing for SIBO. A robust finding of reduced lymphocyte count in 126 IP-probands and 79 spouses (without clinically-definite IP), compared with that in 381 controls (p < 0.001 in each case), was not explained by Helicobacter-status or breath-hydrogen. This complements a previous report that spouses were 'down-the-pathway' to 'clinically-definite' disease. In 205 other controls without clinically-definite IP, there were strong associations between sporadic cardinal features and immunoglobulin class concentration, not explained by Helicobacter-status. Premonitory states for idiopathic parkinsonism associated with relative lymphopenia, higher serum immunoglobulin concentrations and evidence of enteric-nervous-system damage may prove viral in origin.Although only 8% of the above 79 spouses were urea-breath-test-positive for Helicobacter, all 8 spouses with clinically-definite IP were (p < 0.0001). Transmission of a 'primer' to a Helicobacter-colonised recipient might result in progression to the diagnostic threshold. Twenty-five percent of the 126 probands were seropositive for anti-nuclear autoantibody. In 20 probands, monitored before and serially after anti-Helicobacter therapy, seropositivity marked a severe hypokinetic response (p = 0.03). It may alert to continuing infection, even at low-density. Hyperhomocysteinemia is a risk factor for dementia and depression. Serum homocysteine exceeded the target in 43% of the 126 IP-probands. It was partially explained by serum B12 (12% variance, p < 0.001), but not by Helicobacter-status (gastric-atrophy uncommon in IP) or levodopa treatment. Immune-inflammatory activation increases homocysteine production. Since an estimated 60% of probands are hydrogen-breath-test positive, SIBO, with its increased bacterial utilisation of B12, is a likely cause. Thus, two prognostic indicators in established IP fit with involvement of Helicobacter and SIBO.
Figures


Similar articles
-
Leukocyte-subset counts in idiopathic parkinsonism provide clues to a pathogenic pathway involving small intestinal bacterial overgrowth. A surveillance study.Gut Pathog. 2012 Oct 19;4(1):12. doi: 10.1186/1757-4749-4-12. Gut Pathog. 2012. PMID: 23083400 Free PMC article.
-
Helicobacter hypothesis for idiopathic parkinsonism: before and beyond.Helicobacter. 2008 Oct;13(5):309-22. doi: 10.1111/j.1523-5378.2008.00622.x. Helicobacter. 2008. PMID: 19250506 Free PMC article. Review.
-
Towards defining a rigidity-associated pathogenic pathway in idiopathic parkinsonism.Neurodegener Dis. 2012;10(1-4):183-6. doi: 10.1159/000332807. Epub 2011 Dec 23. Neurodegener Dis. 2012. PMID: 22205039 Review.
-
Functional 13C-urea and glucose hydrogen/methane breath tests reveal significant association of small intestinal bacterial overgrowth in individuals with active Helicobacter pylori infection.Clin Biochem. 2017 Jan;50(1-2):46-49. doi: 10.1016/j.clinbiochem.2016.08.017. Epub 2016 Aug 30. Clin Biochem. 2017. PMID: 27586816
-
Role of Helicobacters in Neuropsychiatric Disease: A Systematic Review in Idiopathic Parkinsonism.J Clin Med. 2020 Jul 8;9(7):2159. doi: 10.3390/jcm9072159. J Clin Med. 2020. PMID: 32650535 Free PMC article. Review.
Cited by
-
Peripheral aetiopathogenic drivers and mediators of Parkinson's disease and co-morbidities: role of gastrointestinal microbiota.J Neurovirol. 2016 Feb;22(1):22-32. doi: 10.1007/s13365-015-0357-8. Epub 2015 Jun 20. J Neurovirol. 2016. PMID: 26092111 Free PMC article. Review.
-
Leukocyte-subset counts in idiopathic parkinsonism provide clues to a pathogenic pathway involving small intestinal bacterial overgrowth. A surveillance study.Gut Pathog. 2012 Oct 19;4(1):12. doi: 10.1186/1757-4749-4-12. Gut Pathog. 2012. PMID: 23083400 Free PMC article.
-
Approach to Helicobacter pylori infection in geriatric population.World J Gastrointest Pharmacol Ther. 2014 Aug 6;5(3):139-47. doi: 10.4292/wjgpt.v5.i3.139. World J Gastrointest Pharmacol Ther. 2014. PMID: 25133042 Free PMC article. Review.
-
Berlin Bowel Bothers: Might Adolf Hitler's Gut Problems Have Been Parkinson-Related?Eur Neurol. 2023;86(3):222-227. doi: 10.1159/000530166. Epub 2023 Mar 15. Eur Neurol. 2023. PMID: 36921591 Free PMC article.
-
Differential effect of Helicobacter pylori eradication on time-trends in brady/hypokinesia and rigidity in idiopathic parkinsonism.Helicobacter. 2010 Aug;15(4):279-94. doi: 10.1111/j.1523-5378.2010.00768.x. Helicobacter. 2010. PMID: 20633189 Free PMC article. Clinical Trial.
References
LinkOut - more resources
Full Text Sources
