. 2009 Nov 25;36(4):667-81.
doi: 10.1016/j.molcel.2009.11.001.

Discovering hematopoietic mechanisms through genome-wide analysis of GATA factor chromatin occupancy

Affiliations

Discovering hematopoietic mechanisms through genome-wide analysis of GATA factor chromatin occupancy

Tohru Fujiwara et al. Mol Cell. .

Abstract

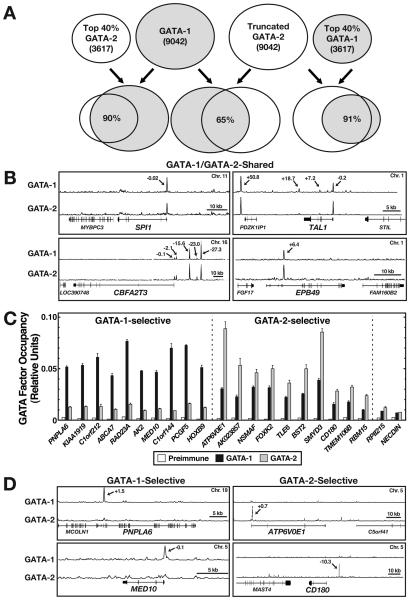
GATA factors interact with simple DNA motifs (WGATAR) to regulate critical processes, including hematopoiesis, but very few WGATAR motifs are occupied in genomes. Given the rudimentary knowledge of mechanisms underlying this restriction and how GATA factors establish genetic networks, we used ChIP-seq to define GATA-1 and GATA-2 occupancy genome-wide in erythroid cells. Coupled with genetic complementation analysis and transcriptional profiling, these studies revealed a rich collection of targets containing a characteristic binding motif of greater complexity than WGATAR. GATA factors occupied loci encoding multiple components of the Scl/TAL1 complex, a master regulator of hematopoiesis and leukemogenic target. Mechanistic analyses provided evidence for crossregulatory and autoregulatory interactions among components of this complex, including GATA-2 induction of the hematopoietic corepressor ETO-2 and an ETO-2-negative autoregulatory loop. These results establish fundamental principles underlying GATA factor mechanisms in chromatin and illustrate a complex network of considerable importance for the control of hematopoiesis.


Figures

Figure 1
Figure 1. Representative GATA-1 Targets Identified Through ChIP-seq Analysis
GATA-1 signal maps are shown for representative hematopoietic transcription factors, signaling molecules and red cell cytoskeletal proteins. Arrows, ChIP-seq peak locations relative to the transcription start site of the respective GATA-1 target gene (kb).
Figure 2
Figure 2. Validation of Human ChIP-seq Results in Murine G1E-ER-GATA-1 cells
Quantitative real-time ChIP analysis of ER-GATA-1 and GATA-2 occupancy at 13 high (A) and low (B) ChIP-seq hits containing conserved WGATAR motifs in both β-estradiol-untreated and -treated (1 μM, 24 h) G1E-ER-GATA-1 cells (mean +/− SE, 3 independent experiments).
Figure 3
Figure 3. Computational/Statistical Mining of ChIP-seq Data
(A, B) The 5,749 ChIP-seq peaks were classified by (A) locations relative to nearest-neighbor genes and (B) GATA motif pattern within each peak. (C) Sequence logos from 5051 WGATAR-containing (left) and 301 E-box-WGATAR-containing (right) peaks. The logo on the left was obtained by de novo motif finding using MEME, while the logo on the right was generated by aligning E-box-WGATAR sequences within peaks. Information content was measured in bits (ranging from 0 to 2 for a given position of sequence). A position in the motif at which all nucleotides occur with equal probability has a value of 0, while a position at which only a single nucleotide can occur has a value of 2. (D) Merged ChIP-seq and Illumina expression profiling results. ChIP-seq peaks were merged with array data profiling expression in untreated and β-estradiol-treated (1 μM, 24 h) G1E-ER-GATA-1 cells (2 independent experiments). Among 296 genes shared by both datasets, the top 60 activated and repressed genes are shown. Asterisk, gene demonstrated previously to be differentially expressed in G1E-ER-GATA-1 cells (Welch et al., 2004). (E) Quantitative ChIP analysis of GATA-1 occupancy in primary murine Ter119+ bone marrow cells (mean +/− SE, 2 independent experiments). Asterisk, significantly greater GATA-1 occupancy compared to the Ey promoter (p < 0.05). Preimmune signals were analyzed with all primer sets and did not exceed 0.0025.
Figure 4
Figure 4. Comparison of GATA-1 and GATA-2 Chromatin Occupancy Genome-Wide by ChIP-seq
(A) Peaks were called on the merged GATA-1 and merged GATA-2 replicate datasets (9,042 and 21,167 for GATA-1 and GATA-2, respectively). GATA-2 peaks were ranked and truncated to the size of the GATA-1 peak list. A comparison of the 9,042 GATA-1 and GATA-2 peaks revealed 65% overlap. Using the ENCODE overlap rule, the top 40% of each peak file was compared to the entire set of 9,042 peaks for the other factor. A 90-91% overlap was observed, indicating that the majority of the highest ranked peaks for each factor are contained within the peak set for the other factor. When the ENCODE overlap rule is applied to replicate datasets of the same factor, high quality datasets often overlap by 80-90%. (B) ChIP-seq signal maps for GATA-1/GATA-2-shared targets. Arrows, ChIP-seq peak locations relative to the transcription start site (kb). (C) Quantitative ChIP analysis of GATA factor occupancy at GATA-1- and GATA-2-selective targets in K562 cells (mean +/− SE, 3 independent experiments). (D) ChIP-seq signal maps for GATA-1- and GATA-2-selective targets. Arrows, ChIP-seq peak locations relative to the transcription start site (kb).
Figure 5
Figure 5. ETO-2 Negative Autoregulatory Loop
(A) Cbfa2t3 locus organization (UCSC genome assembly: uc009ntn.1). Open and filled boxes, noncoding and coding exons, respectively. Asterisk, locations of conserved E-boxWGATAR motif; downward pointing arrows, WGATAR motifs conserved from mouse to human. Four WGATAR motifs located at −21.7, −21.6, −21.6, and −21.5 kb were analyzed as a cluster. The VISTA plot depicts sequence identity between mouse and human, using mouse as a reference. (B) Quantitative RT-PCR analysis of Cbfa2t3 mRNA (left) (mean +/− SE, 4 independent experiments) and anti-ETO-2 Western blot of whole cell extracts (right) from G1E cells transfected with siRNA against mouse Cbfa2t3 or control siRNA. Asterisk, cross-reactive band. (C) Analysis of ETO-2 occupancy at the Cbfa2t3 locus (−21.6 kb) in ETO-2-knockdown and control G1E cells (mean +/− SE, 2 independent experiments). (D) Cbfa2t3 primary transcripts were quantitated by real-time RT-PCR analysis in control and ETO-2-knockdown G1E cells (mean +/− SE, 4 independent experiments). Two primer sets (Intron1/Intron1 and Intron11/Exon12) were used. Gapdh mRNA was quantitated as a control. (E) Analysis of Pol II and P-Ser5-Pol II occupancy at Cbfa2t3 (left and middle) and RPII215 (right) promoters in ETO-2-knockdown and control G1E cells (mean +/− SE, 2 independent experiments). Two primer sets were used to analyze the Cbfa2t3 promoter. (F) Analysis of AcH3 at the Cbfa2t3 −21.6 kb (left), Cbfa2t3 promoter-B (middle), and RPII215 promoter (right) in ETO-2-knockdown and control G1E cells (mean +/− SE, 2 independent experiments).
Figure 6
Figure 6. Context-Dependent ETO-2 Corepressor Function at Endogenous Loci
(A) The diagram depicts the location of the ChIP-seq peaks analyzed. Asterisk, location of the corresponding peak in mouse; shaded boxes, coding regions. (B) Analysis of ETO-2 occupancy at GATA target genes in G1E cells transfected with control or Cbfa2t3 siRNA (mean +/− SE, 2 independent experiments). Asterisk, p < 0.05. (C, D) Real-time RT-PCR analysis of GATA target genes in G1E cells (C) and G1E-ER-GATA1 cells (D) transfected with control or Cbfa2t3 siRNA. For G1E-ER-GATA1 cells, β-estradiol was added 24 h after the initial siRNA transfection and cells were cultured for 24 h. mRNA levels were normalized to Gapdh mRNA (mean +/− SE, 3 and 4 independent experiments for Fig. 6C and 6D, respectively). The relative transcript level for control G1E-ER-GATA-1 cells was designated as 1. Asterisk, p < 0.05. (E) Models for ETO-2-dependent repression of Slc4a1. GATA-2 occupies the repressed Slc4a1 promoter (left), and ETO-2 loss suffices for induction (right, upper) or is coupled to GATA-2 loss (right, lower). (F) Analysis of GATA-2 occupancy at the Slc4a1 promoter in G1E cells transfected with control or Cbfa2t3 siRNA (mean +/− SE, 2 independent experiments).
Figure 7
Figure 7. Regulatory Interactions Among Components of Complexes Containing Master Regulators of Hematopoiesis and Leukemogenic Factors
(A) The table summarizes changes in the expression of genes in day 3/4, 6 and 8 EBs derived from mouse ES cells following Dox-mediated GATA-2 induction (mean +/− SE, 9 independent experiments for day 3/4 and day 6 EBs; 6 independent experiments for day 8 EBs), day 4 EBs from mouse ES cells following Dox-mediated Scl/TAL1 induction (mean +/− SE, 3 independent experiments), and G1E-ER-GATA1 cells after β-estradiol-treatment (1 μM for 3, 8 and 24 h; mean +/− SE, 2 independent experiments). For EBs derived from Gata2−/− and Scl/TAL1−/− ES cells, values are expressed relative to that of wild-type EBs, which has a value of 1.0. mRNA levels were quantitated by real-time RT-PCR, and the expression level was divided by that of corresponding control cells. (B) The model summarizes cross-regulatory interactions among Scl/TAL1 complex components. (C) Model demonstrating GATA-2 activation of Cbfa2t3 transcription, ETO-2 negative autoregulatory loop, and GATA switch-mediated Cbfa2t3 repression.

Similar articles

Cited by

References

    1. Amann JM, Nip J, Strom DK, Lutterbach B, Harada H, Lenny N, Downing JR, Meyers S, Hiebert SW. ETO, a target of t(8:21) in acute leukemia, makes distinct contacts with multiple histone deacetylases and binds Sin3A through its oligomerization domain. Mol Cell Biol. 2001;21:6470–6483. - PMC - PubMed
    1. Anguita E, Hughes J, Heyworth C, Blobel GA, Wood WG, Higgs DR. Globin gene activation during hematopoiesis is driven by protein complexes nucleated by GATA-1 and GATA-2. EMBO J. 2004;23:2841–2852. - PMC - PubMed
    1. Aplan PD, Lombardi DP, Reaman GH, Sather HN, Hammond GD, Kirsch IR. Involvement of the putative hematopoietic transcription factor SCL in T- cell acute lymphoblastic leukemia. Blood. 1992;79:1327–1333. - PubMed
    1. Bailey TL, Elkan C. Unsupervised learning of multiple motifs in biopolymers using EM. Machine Learning. 1995;21:51–80.
    1. Begley CG, Aplan PD, Denning SM, Haynes BF, Waldmann TA, Kirsch IR. The gene SCL is expressed during early hematopoiesis and encodes a differentiation-related DNA-binding motif. Proc Natl Acad Sci U S A. 1989;86:10128–10132. - PMC - PubMed

Publication types

MeSH terms

Associated data