Comparative Study
. 2009 Nov 25;36(4):682-95.
doi: 10.1016/j.molcel.2009.11.002.

Insights into GATA-1-mediated gene activation versus repression via genome-wide chromatin occupancy analysis

Affiliations
Comparative Study

Insights into GATA-1-mediated gene activation versus repression via genome-wide chromatin occupancy analysis

Ming Yu et al. Mol Cell. .

Abstract

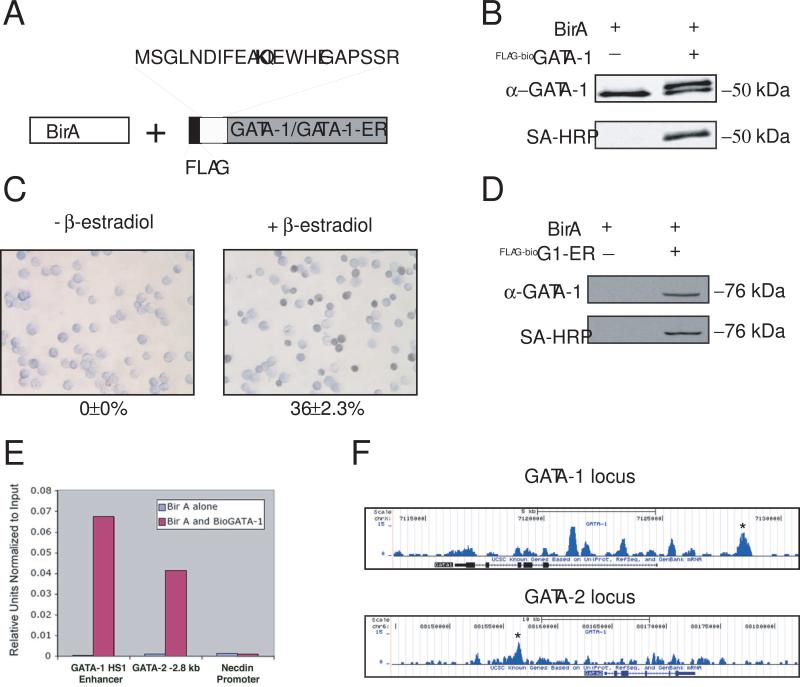
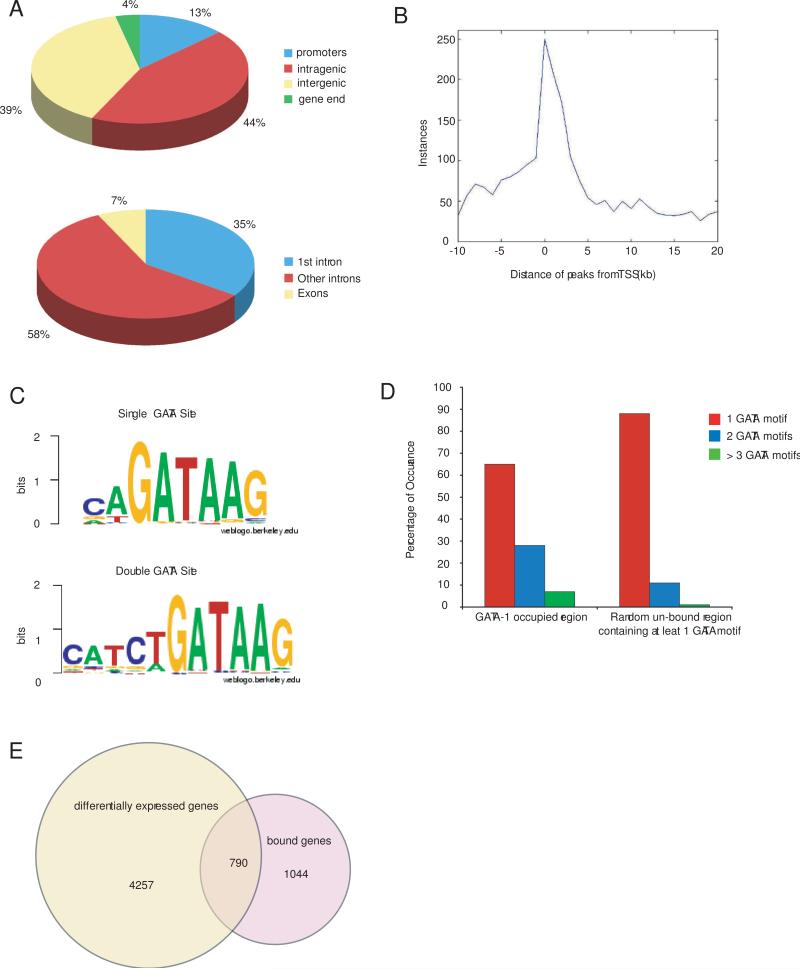
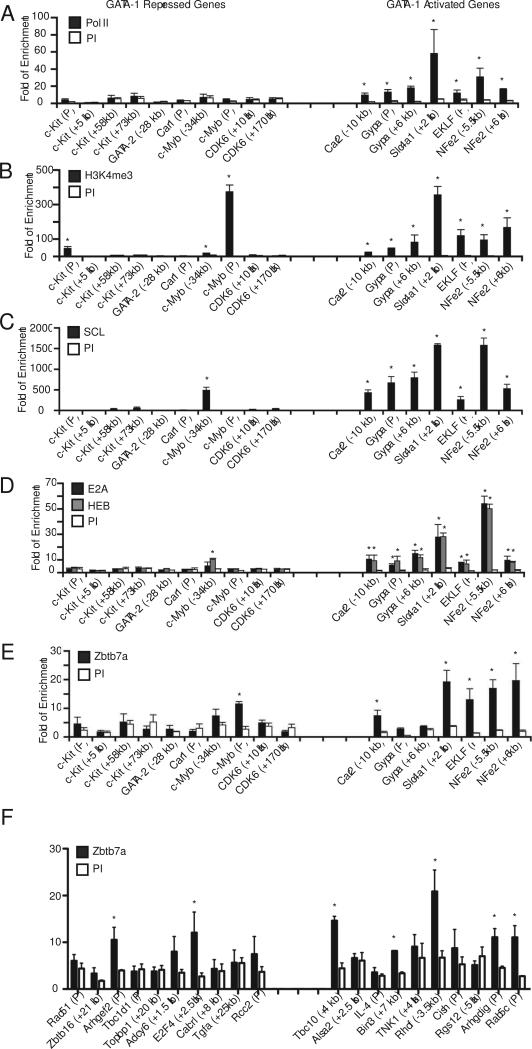
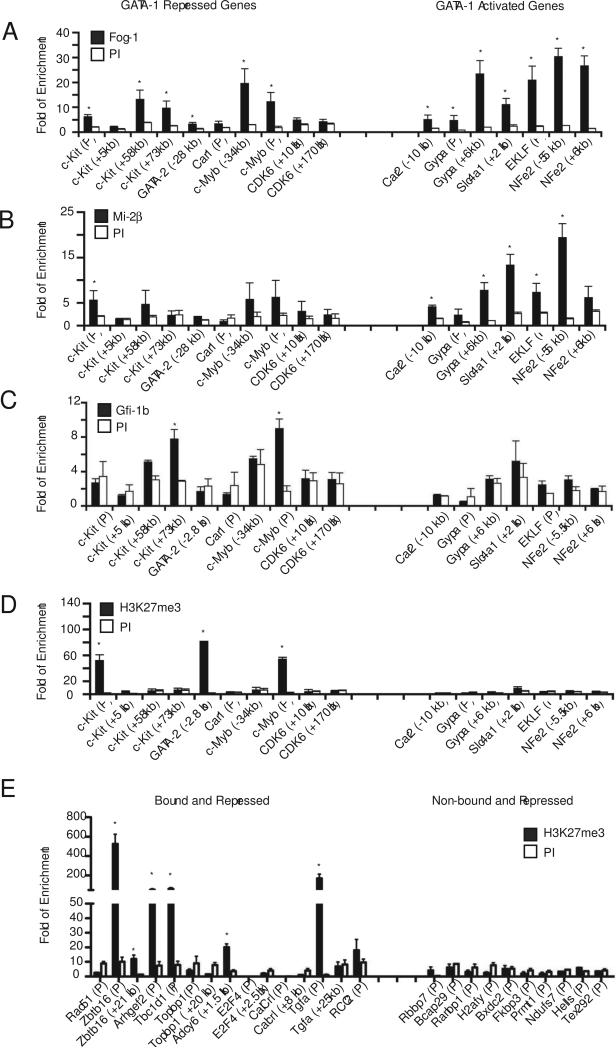
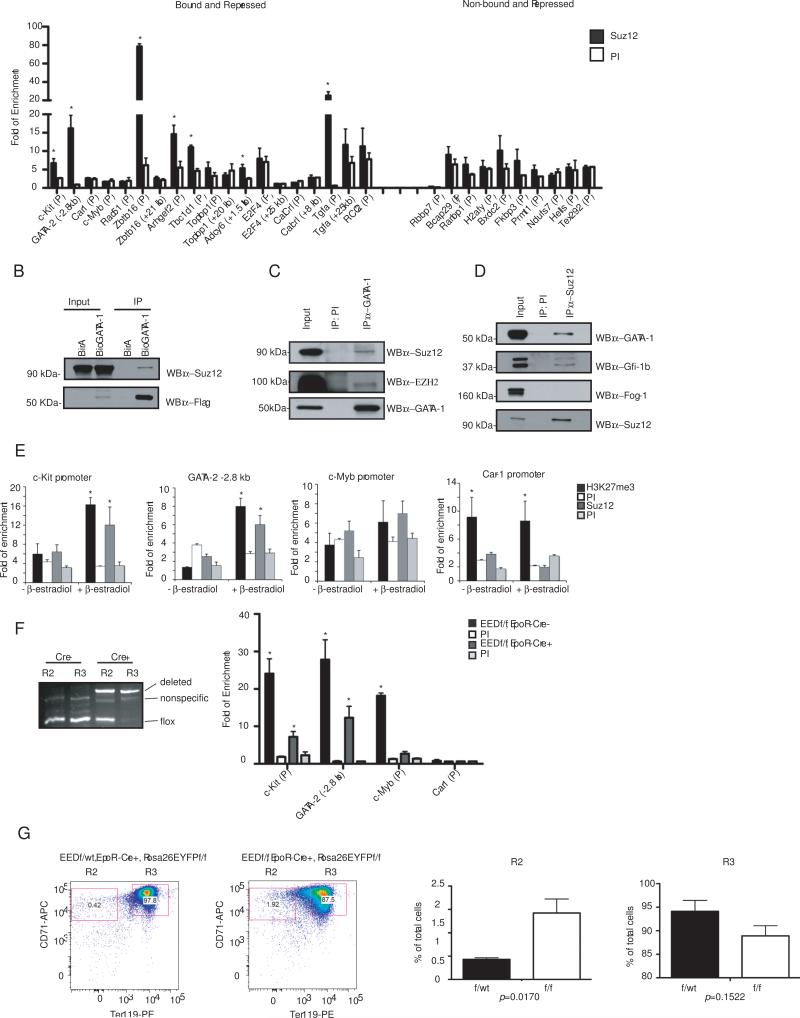
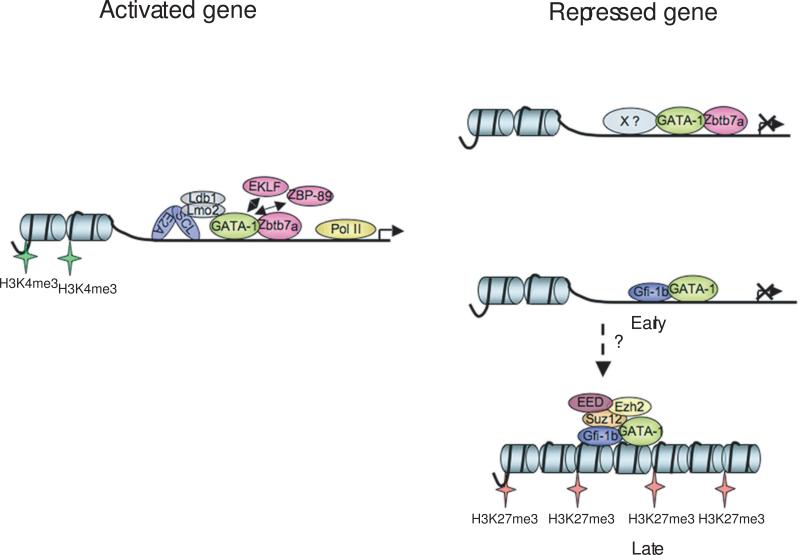
The transcription factor GATA-1 is required for terminal erythroid maturation and functions as an activator or repressor depending on gene context. Yet its in vivo site selectivity and ability to distinguish between activated versus repressed genes remain incompletely understood. In this study, we performed GATA-1 ChIP-seq in erythroid cells and compared it to GATA-1-induced gene expression changes. Bound and differentially expressed genes contain a greater number of GATA-binding motifs, a higher frequency of palindromic GATA sites, and closer occupancy to the transcriptional start site versus nondifferentially expressed genes. Moreover, we show that the transcription factor Zbtb7a occupies GATA-1-bound regions of some direct GATA-1 target genes, that the presence of SCL/TAL1 helps distinguish transcriptional activation versus repression, and that polycomb repressive complex 2 (PRC2) is involved in epigenetic silencing of a subset of GATA-1-repressed genes. These data provide insights into GATA-1-mediated gene regulation in vivo.


Figures

Figure 1
Figure 1
Streptavidin ChIP-Seq of metabolically biotinylated GATA-1 in induced MEL cells. (A) Schematic diagram of metabolic biotin tagging system. birA, E.coli biotin ligase. The birA recognition motif and FLAG epitope tag is shown fused to the amino terminus of GATA-1 or GATA-1ER. The biotin acceptor lysine is indicated in bold. (B) Western blot of nuclear extracts from MEL cell clones expressing either birA alone, or birA and the recombinant GATA-1 (FLAG-BioGATA-1). Upper panel, probed with anti-GATA-1 antibody; Lower panel, same as upper panel after stripping and re-probing with streptavidin-horse radish peroxidase (SA-HRP). (C) O-dianosidine (benzidine) stain of G1E cells expressing FLAG-BioGATA-1-ER without (left) or with (right) treatment with β-estradiol for 48 hrs. Hemoglobinized cells stain dark brown/black. The percentage of positive cells is indicated below the panel (−/+ standard error of the mean (SEM); n=3). (D) Western blot of nuclear extracts from cell shown in “C” probed with anti-GATA-1 antibody (top) and SA-HRP (bottom). (E) Quantitative ChIP assay at two known GATA-1 occupancy sites (GATA-1 HS1 and GATA-2 “−2.8 kb” enhancer) and a negative control site (necdin promoter) using streptavidin-based ChIP from induced MEL cells (DMSO for 24 hrs) expressing birA alone or birA and FLAG-BioGATA-1. (F) Streptavidin ChIP-Seq enrichment profiles for FLAG-BioGATA-1 at the GATA-1 and GATA-2 loci. Enrichment peaks corresponding to GATA-1 HS1 and GATA-2 “−2.8 kb” are indicated with asterisks.
Figure 2
Figure 2
Bioinformatic analysis of GATA-1 global occupancy. (A) Top, pie diagram showing distribution of GATA-1 enrichment peaks located in the promoter (−10 kb to the TSS), intragenic sites, 3’end of gene (3 kb 3’ to the gene end), or intergenic sites (outside of these defined regions). Bottom, pie diagram showing distribution of intronic versus exonic GATA-1 enrichment peaks among intragenic sites. (B) Frequency of GATA-1 enrichment peaks according to their position relative to the TSS. (C) Single (top) and double (bottom) GATA binding motif preferences based on occupancy at the 200 highest promoter region peaks using THEME. (D) Graph showing the percentage of occurrences of 1, 2, or > 3 GATA binding motifs in GATA-1 occupied regions versus 10 sets of random non-bound regions that contain at least one GATA binding motif. (E) Ven diagram showing the number of differentially expressed genes after induction of G1-ER4 cells, the number of genes bound by GATA-1, and the overlap between the two.
Figure 3
Figure 3
ChIP analysis for occupancy of candidate activating factors and histone modifications at GATA-1 bound regions of five activated and repressed genes in sorted CD71+/lowTer119+ primary e13.5-14.5 fetal liver cells. (A) Pol II, (B) H3K4me3, (C) SCL/TAL1, (D) E2A/HEB, and (E, F) Zbtb7a. PI, pre-immune or random pooled species-matched IgG. Results are shown as fold enrichment compared to a region located 2 kb 5’ to GATA-1 HS1, which is devoid of GATA-1 binding sites. The mean of 3 independent ChIP assays is shown −/+ SEM. Enrichment differences between specific and control antibodies > 2-fold and with p-values < 0.05 (Student's t-test) are indicated with an asterisk. All GATA-1 occupancy sites detected in the ChIP-seq dataset from induced MEL cells were included. The promoter regions of c-kit and c-myb were also included, even though GATA-1 occupancy was not detected in this region. The c-myb occupancy site was located beyond the −10 kb to TSS window, but was included here given the role of c-myb in erythroid development.
Figure 4
Figure 4
ChIP analysis for occupancy of candidate repressive factors and histone modifications at GATA-1 bound regions of activated and repressed genes in sorted CD71+/lowTer119+ primary e13.5-14.5 fetal liver cells. (A) FOG-1, (B) Mi-2 , (C) Gfi-1b, and (D,E) H3K27me3. Details of the ChIP assays are as described in Figure 3.
Figure 5
Figure 5
Role of PRC2 at direct GATA-1 repressed genes. (A) ChIP assays for occupancy of Suz12 at the indicated GATA-1 repressed genes. Results are expressed as fold change compared to negative control region located 2 kb 5’ to GATA-1 HS1, and represent the mean of 3 independent experiments +/− SEM. Enrichment differences between specific and control antibodies > 2-fold and with p-values < 0.05 (Student's t-test) are indicated with an asterisk. (B) Association of Suz12 with FLAG-BioGATA-1 in induced MEL cells. Western blot analysis using anti-Suz12 or anti-FLAG antibodies of eluted material after SA affinity pull-down from MEL cells expressing birA alone or birA and FLAG-BioGATA-1. 10% input is shown. (C) Co-IP of endogenous Suz12 and EZH2 with GATA-1 from induced MEL cells. 20% input is shown. (D) Co-IP of endogenous GATA-1, Gfi-1b and FOG-1, with Suz12 from induced MEL cells. 20% input is shown. (E) ChIP analysis for Suz12 occupancy and H3K27me3 at the indicated sites in G1ER-4 cells before and 48 hrs after addition of β-estradiol. (F) Left panel, genomic PCR analysis from FACS-sorted “R2” (lin CD71+Ter119) and “R3” (lin (except Ter119) CD71+Ter119+) cell populations for EED allele deletion of EEDfl/fl, EpoR-Cre and EEDfl/fl, EpoR-Cre+ mice. The expected PCR product positions for the deleted and floxed alleles are indicated. A non-specific band is present in all lanes. Right panel, ChIP assay for H3K27me3 at the indicated sites in FACS-sorted “R3” cells from e13.5 fetal livers of EEDfl/fl, EpoR-Cre or EEDfl/fl, EpoR-Cre+ embryos. Details of the ChIP assay are as in “A”. The mean value is indicated −/+ SEM (n=3). (G) Effect of loss of EED on erythroid maturation in vivo. Left panel, flow cytometric analysis for CD71 and Ter119 expression of EYFP+ cells from representative EEDfl/wt, Rosa26-floxed stopper EYFP+, Epo-R Cre+ (left) versus EEDfl/fl, Rosa26-floxed stopper EYFP+, Epo-R Cre+ (right) embryonic e13.5 fetal livers. Right panel, compilation of data from 4 independent animals each, showing the percentage of cells in the “R2” and “R3” populations −/+ SEM.
Figure 6
Figure 6
Model of transcription factor and cofactor occupancy at in vivo GATA-1 binding sites correlating with gene activation versus repression.

References

    1. Andrews NC, Erdjument-Bromage H, Davidson MB, Tempst P, Orkin SH. Erythroid transcription factor NF-E2 is a haematopoietic-specific basic-leucine zipper protein. Nature. 1993;362:722–728. - PubMed
    1. Bresnick EH, Martowicz ML, Pal S, Johnson KD. Developmental control via GATA factor interplay at chromatin domains. J Cell Physiol. 2005;205:1–9. - PubMed
    1. Cantor AB, Orkin SH. Hematopoietic development: a balancing act. Curr Opin Genet Dev. 2001;11:513–519. - PubMed
    1. Cheng Y, King DC, Dore LC, Zhang X, Zhou Y, Zhang Y, Dorman C, Abebe D, Kumar SA, Chiaromonte F, et al. Transcriptional enhancement by GATA1-occupied DNA segments is strongly associated with evolutionary constraint on the binding site motif. Genome Res. 2008;18:1896–1905. - PMC - PubMed
    1. Darley RL, Hoy TG, Baines P, Padua RA, Burnett AK. Mutant N-RAS induces erythroid lineage dysplasia in human CD34+ cells. J Exp Med. 1997;185:1337–1347. - PMC - PubMed

Publication types

MeSH terms

Associated data