A rapid and sensitive method to detect siRNA-mediated mRNA cleavage in vivo using 5' RACE and a molecular beacon probe
- PMID: 19942683
- PMCID: PMC2817477
- DOI: 10.1093/nar/gkp1076
A rapid and sensitive method to detect siRNA-mediated mRNA cleavage in vivo using 5' RACE and a molecular beacon probe
Abstract
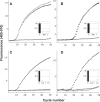
Specific detection of mRNA cleavage by 5'RACE is the only method to confirm the knockdown of mRNA by RNA interference, but is rarely reported for in vivo studies. We have combined 5'-RNA-linker-mediated RACE (5'-RLM-RACE) with real-time PCR using a molecular beacon to develop a rapid and specific method termed MBRACE, which we have used to detect small-interfering RNA (siRNA)-induced cleavage of ApoB, RRM1 and YBX1 transcripts in vitro, and ApoB in vivo. When RNA from siRNA-transfected cells was used for 5'-RLM-RACE and a cleavage site-specific molecular beacon probe was included in subsequent real-time PCR analysis, the specific mRNA cleavage product was detected. Detection of siRNA-mediated cleavage was also observed when RNA from mouse liver following administration of ApoB-specific siRNA was analysed, even in cases where ApoB knockdown measured by real-time PCR was <10%. With its sensitivity and specificity, this variation on the 5'RACE method should prove a useful tool to detect mRNA cleavage and corroborate knockdown studies following siRNA use in vivo.
Figures


Similar articles
-
Efficient in vivo delivery of siRNA to the liver by conjugation of alpha-tocopherol.Mol Ther. 2008 Apr;16(4):734-40. doi: 10.1038/mt.2008.14. Epub 2008 Feb 12. Mol Ther. 2008. PMID: 18362929
-
RNAi-mediated gene silencing in non-human primates.Nature. 2006 May 4;441(7089):111-4. doi: 10.1038/nature04688. Epub 2006 Mar 26. Nature. 2006. PMID: 16565705
-
Hammerhead ribozyme cleavage of apolipoprotein B mRNA generates a truncated protein.J Biol Chem. 1999 Aug 20;274(34):24161-70. doi: 10.1074/jbc.274.34.24161. J Biol Chem. 1999. PMID: 10446190
-
APOLIPOPROTEIN B: mRNA editing, lipoprotein assembly, and presecretory degradation.Annu Rev Nutr. 2000;20:169-93. doi: 10.1146/annurev.nutr.20.1.169. Annu Rev Nutr. 2000. PMID: 10940331 Review.
-
[Small interference RNAs directed against KDR gene inhibit the proliferation of breast cancer cells in vitro and in vivo].Xi Bao Yu Fen Zi Mian Yi Xue Za Zhi. 2008 Jan;24(1):58-61. Xi Bao Yu Fen Zi Mian Yi Xue Za Zhi. 2008. PMID: 18177622 Review. Chinese.
Cited by
-
Anti-CD22 antibody targeting of pH-responsive micelles enhances small interfering RNA delivery and gene silencing in lymphoma cells.Mol Ther. 2011 Aug;19(8):1529-37. doi: 10.1038/mt.2011.104. Epub 2011 May 31. Mol Ther. 2011. PMID: 21629223 Free PMC article.
-
Gene regulation by small RNAs.J RNAi Gene Silencing. 2010 Apr 25;6(1):376-8. J RNAi Gene Silencing. 2010. PMID: 20628497 Free PMC article. No abstract available.
-
SMG6 cleavage generates metastable decay intermediates from nonsense-containing β-globin mRNA.PLoS One. 2013 Sep 25;8(9):e74791. doi: 10.1371/journal.pone.0074791. eCollection 2013. PLoS One. 2013. PMID: 24086375 Free PMC article.
-
Silencing disease genes in the laboratory and the clinic.J Pathol. 2012 Jan;226(2):365-79. doi: 10.1002/path.2993. Epub 2011 Nov 9. J Pathol. 2012. PMID: 22069063 Free PMC article. Review.
-
N-Methyl-D-Aspartate Receptor Hypofunction in Meg-01 Cells Reveals a Role for Intracellular Calcium Homeostasis in Balancing Megakaryocytic-Erythroid Differentiation.Thromb Haemost. 2020 Apr;120(4):671-686. doi: 10.1055/s-0040-1708483. Epub 2020 Apr 14. Thromb Haemost. 2020. PMID: 32289863 Free PMC article.
References
-
- Dykxhoorn DM, Lieberman J. Running interference: prospects and obstacles to using small interfering RNAs as small molecule drugs. Annu. Rev. Biomed. Eng. 2006;8:377–402. - PubMed
-
- Robbins M, Judge A, MacLachlan I. siRNA and innate immunity. Oligonucleotides. 2009;19:89–102. - PubMed
-
- Rossi JJ. Innate immunity confounds the clinical efficacy of small interfering RNAs (siRNAs) Gene Ther. 2009;16:579–580. - PubMed
Publication types
MeSH terms
Substances
LinkOut - more resources
Full Text Sources
Other Literature Sources
Miscellaneous

