

Inferring a transcriptional regulatory network of the cytokinesis-related genes by network component analysis
- PMID: 19943917
- PMCID: PMC2800846
- DOI: 10.1186/1752-0509-3-110
Inferring a transcriptional regulatory network of the cytokinesis-related genes by network component analysis
Abstract
Background: Network Component Analysis (NCA) is a network structure-driven framework for deducing regulatory signal dynamics. In contrast to principal component analysis, which can be employed to select the high-variance genes, NCA makes use of the connectivity structure from transcriptional regulatory networks to infer dynamics of transcription factor activities. Using the budding yeast Saccharomyces cerevisiae as a model system, we aim to deduce regulatory actions of cytokinesis-related genes, using precise spatial proximity (midbody) and/or temporal synchronicity (cytokinesis) to avoid full-scale computation from genome-wide databases.
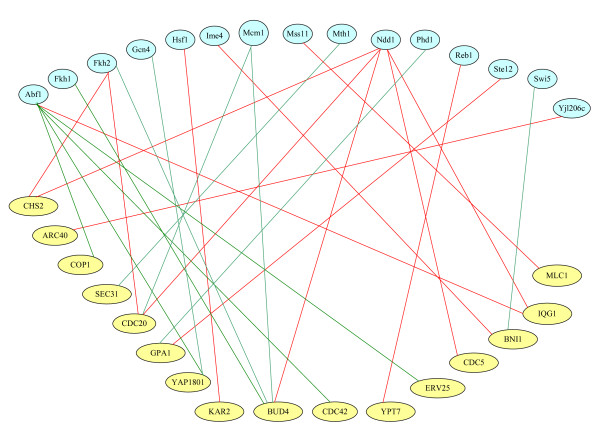
Results: NCA was applied to infer regulatory actions of transcription factor activity from microarray data and partial transcription factor-gene connectivity information for cytokinesis-related genes, which were a subset of genome-wide datasets. No literature has so far discussed the inferred results through NCA are independent of the scale of the gene expression dataset. To avoid full-scale computation from genome-wide databases, four cytokinesis-related gene cases were selected for NCA by running computational analysis over the transcription factor database to confirm the approach being scale-free. The inferred dynamics of transcription factor activity through NCA were independent of the scale of the data matrix selected from the four cytokinesis-related gene sets. Moreover, the inferred regulatory actions were nearly identical to published observations for the selected cytokinesis-related genes in the budding yeast; namely, Mcm1, Ndd1, and Fkh2, which form a transcription factor complex to control expression of the CLB2 cluster (i.e. BUD4, CHS2, IQG1, and CDC5).
Conclusion: In this study, using S. cerevisiae as a model system, NCA was successfully applied to infer similar regulatory actions of transcription factor activities from two various microarray databases and several partial transcription factor-gene connectivity datasets for selected cytokinesis-related genes independent of data sizes. The regulated action for four selected cytokinesis-related genes (BUD4, CHS2, IQG1, and CDC5) belongs to the M-phase or M/G1 phase, consistent with the empirical observations that in S. cerevisiae, the Mcm1-Ndd1-Fkh2 transcription factor complex can regulate expression of the cytokinesis-related genes BUD4, CHS2, IQG1, and CDC5. Since Bud4, Iqg1, and Cdc5 are highly conserved between human and yeast, results obtained from NCA for cytokinesis in the budding yeast can lead to a suggestion that human cells should have the transcription regulator(s) as the budding yeast Mcm1-Ndd1-Fkh2 transcription factor complex in controlling occurrence of cytokinesis.
Figures


References
Publication types
MeSH terms
Substances
LinkOut - more resources
Full Text Sources
Molecular Biology Databases
