Differential protein profiling as a potential multi-marker approach for TSE diagnosis
- PMID: 19943924
- PMCID: PMC2794872
- DOI: 10.1186/1471-2334-9-188
Differential protein profiling as a potential multi-marker approach for TSE diagnosis
Abstract
Background: Transmissible spongiform encephalopathy describes a family of diseases affecting both man and animals. Current tests for the diagnosis of these diseases are based on the detection of an abnormal misfolded form of the host protein PrP which is found within the central nervous and lymphoreticular systems of affected animals. Recently, concern that this marker may not be as reliable as previously thought, coupled with an urgentneed for a pre-clinical live animal test, has led to the search for alternative assays for the detection of TSE disease.
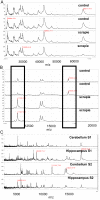
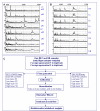
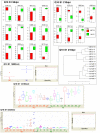
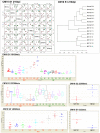
Methods: This "proof of concept" study, examines the use of differential protein expression profiling using surface enhanced laser desorption and ionisationtime of flight mass spectrometry (SELDI-TOF) for the diagnosis of TSE disease. Spectral output from all proteins selectively captured from individual murine brain homogenate samples, are compared as "profiles" in groups of infected and non-infected animals. Differential protein expression between groups is thus highlighted and statistically significant protein "peaks" used to construct a panel of disease specific markers.Studies at both terminal stages of disease and throughout the time course of disease have shown a disease specific protein profile or "disease fingerprint" which could be used to distinguish between groups of TSE infected and uninfected animals at an early time point of disease.
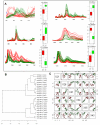
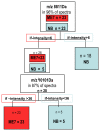
Results: Our results show many differentially expressed proteins in diseased and control animals, some at early stages of disease. Three proteins identified by SELDI-TOF analysis were verified by immunohistochemistry in brain tissue sections. We demonstrate that by combining the most statistically significant changes in expression, a panel of markers can be constructed that can distinguish between TSE diseased and normal animals.
Conclusion: Differential protein expression profiling has the potential to be used for the detection of disease in TSE infected animals. Having established that a "training set" of potential markers can be constructed, more work would be required to further test the specificity and sensitivity of the assay in a "testing set". Based on these promising results, further studies are being performed using blood samples from infected sheep to assess the potential use of SELDI-TOF as a pre-mortem blood based diagnostic.
Figures

Similar articles
-
Differential protein expression profiling in BSE disease.Arch Physiol Biochem. 2010 Oct-Dec;116(4-5):233-43. doi: 10.3109/13813455.2010.504211. Epub 2010 Aug 10. Arch Physiol Biochem. 2010. PMID: 20698762
-
The use of non-prion biomarkers for the diagnosis of Transmissible Spongiform Encephalopathies in the live animal.Vet Res. 2005 Sep-Dec;36(5-6):665-83. doi: 10.1051/vetres:2005028. Vet Res. 2005. PMID: 16120244 Review.
-
Application of serum SELDI proteomic patterns in diagnosis of lung cancer.BMC Cancer. 2005 Jul 20;5:83. doi: 10.1186/1471-2407-5-83. BMC Cancer. 2005. PMID: 16029516 Free PMC article.
-
Quality control and quality assessment of data from surface-enhanced laser desorption/ionization (SELDI) time-of flight (TOF) mass spectrometry (MS).BMC Bioinformatics. 2005 Jul 15;6 Suppl 2(Suppl 2):S5. doi: 10.1186/1471-2105-6-S2-S5. BMC Bioinformatics. 2005. PMID: 16026602 Free PMC article.
-
Blood infectivity, processing and screening tests in transmissible spongiform encephalopathy.Vox Sang. 2005 Aug;89(2):63-70. doi: 10.1111/j.1423-0410.2005.00683.x. Vox Sang. 2005. PMID: 16101685 Review.
Cited by
-
Ovine serum biomarkers of early and late phase scrapie.BMC Vet Res. 2010 Nov 2;6:49. doi: 10.1186/1746-6148-6-49. BMC Vet Res. 2010. PMID: 21044301 Free PMC article.
-
Serum protein profiles as potential biomarkers for infectious disease status in pigs.BMC Vet Res. 2012 Mar 22;8:32. doi: 10.1186/1746-6148-8-32. BMC Vet Res. 2012. PMID: 22439879 Free PMC article.
-
Proteomics analysis of amyloid and nonamyloid prion disease phenotypes reveals both common and divergent mechanisms of neuropathogenesis.J Proteome Res. 2014 Nov 7;13(11):4620-34. doi: 10.1021/pr500329w. Epub 2014 Aug 29. J Proteome Res. 2014. PMID: 25140793 Free PMC article.
-
Investigation of serum protein profiles in scrapie infected sheep by means of SELDI-TOF-MS and multivariate data analysis.BMC Res Notes. 2013 Nov 14;6:466. doi: 10.1186/1756-0500-6-466. BMC Res Notes. 2013. PMID: 24229425 Free PMC article.
-
Applying the tools of chemistry (mass spectrometry and covalent modification by small molecule reagents) to the detection of prions and the study of their structure.Prion. 2014 Jan-Feb;8(1):42-50. doi: 10.4161/pri.27891. Prion. 2014. PMID: 24509645 Free PMC article.
References
-
- Wells GA, Scott AC, Johnson CT, Gunning RF, Hancock RD, Jeffrey M, Dawson M, Bradley R. A novel progressive spongiform encephalopathy in cattle. Vet Rec. 1987;121(18):419–420. - PubMed
-
- Bruce ME. Scrapie strain variation and mutation. Br Med Bull. 1993;49(4):822–838. - PubMed
-
- Williams ES, Miller MW. Chronic wasting disease in deer and elk in North America. Rev Sci Tech. 2002;21(2):305–316. - PubMed
-
- Fraser H, Bruce ME, McBride PA, Scott JR. The molecular pathology of scrapie and the biological basis of lesion targeting. Prog Clin Biol Res. 1989;317:637–644. - PubMed
Publication types
MeSH terms
Substances
Grants and funding
LinkOut - more resources
Full Text Sources
Molecular Biology Databases
Research Materials

