. 2009;8(10):93.
doi: 10.1186/jbiol194.

Generalized immune activation as a direct result of activated CD4+ T cell killing

Affiliations

Generalized immune activation as a direct result of activated CD4+ T cell killing

Rute Marques et al. J Biol. 2009.

Abstract

Background: In addition to progressive CD4(+) T cell immune deficiency, HIV infection is characterized by generalized immune activation, thought to arise from increased microbial exposure resulting from diminishing immunity.

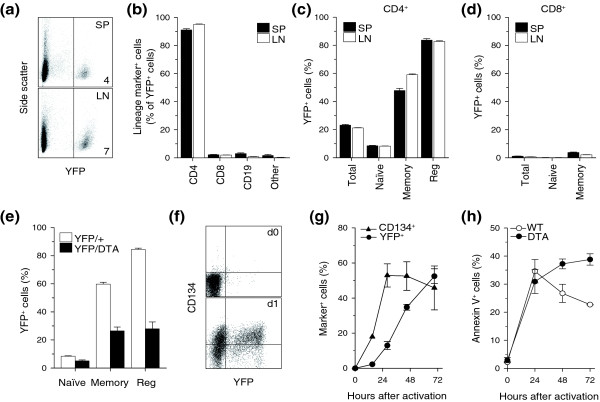
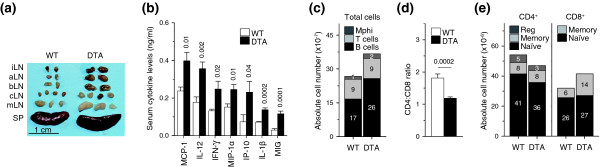
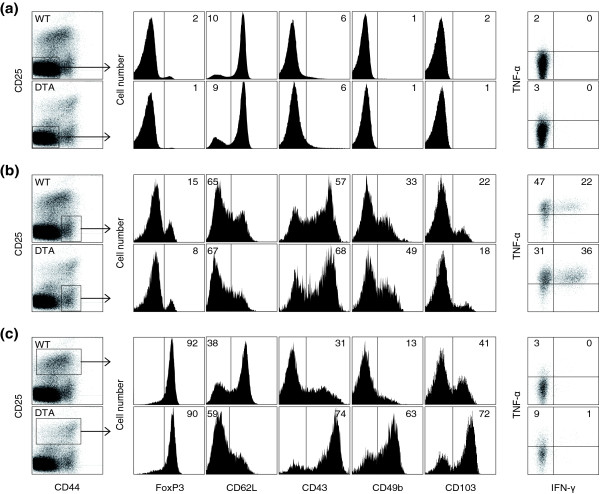
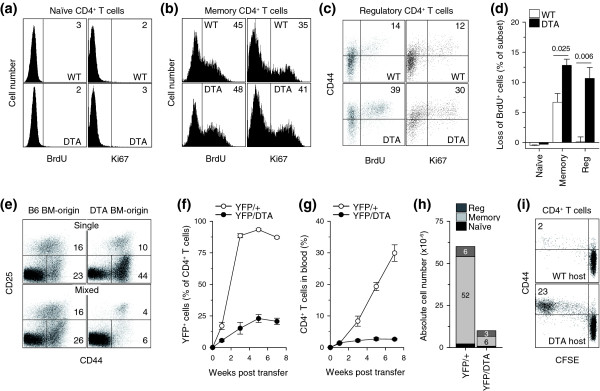
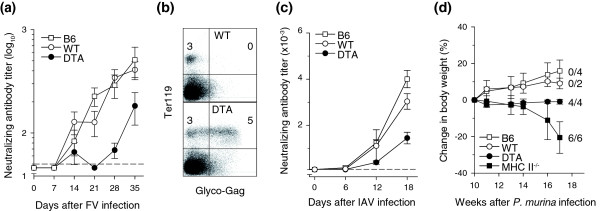
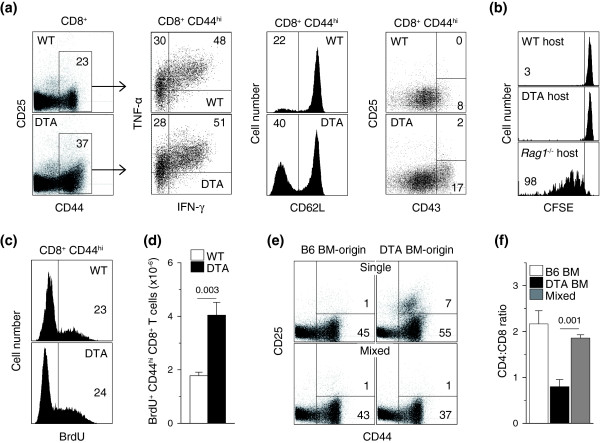
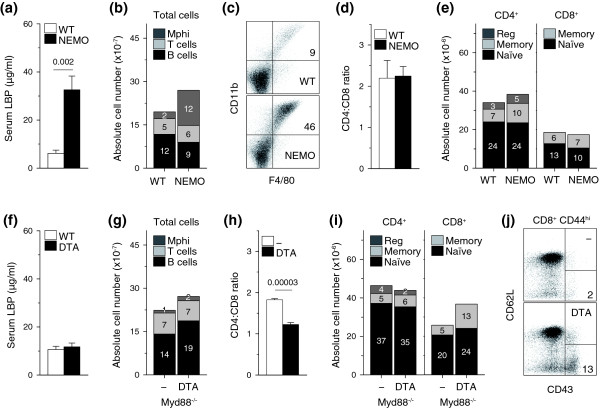
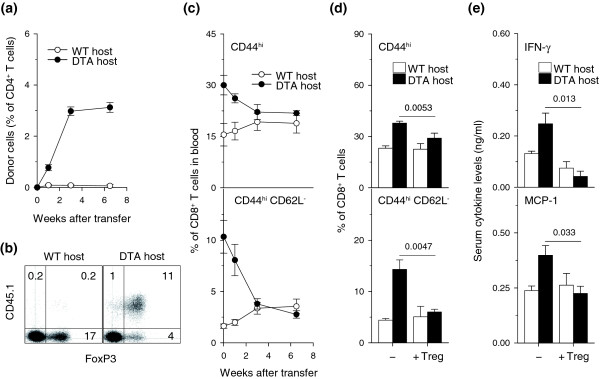
Results: Here we report that, in a virus-free mouse model, conditional ablation of activated CD4(+) T cells, the targets of immunodeficiency viruses, accelerates their turnover and produces CD4(+) T cell immune deficiency. More importantly, activated CD4(+) T cell killing also results in generalized immune activation, which is attributable to regulatory CD4(+) T cell insufficiency and preventable by regulatory CD4(+) T cell reconstitution. Immune activation in this model develops independently of microbial exposure. Furthermore, microbial translocation in mice with conditional disruption of intestinal epithelial integrity affects myeloid but not T cell homeostasis.

Conclusions: Although neither ablation of activated CD4(+) T cells nor disruption of intestinal epithelial integrity in mice fully reproduces every aspect of HIV-associated immune dysfunction in humans, ablation of activated CD4(+) T cells, but not disruption of intestinal epithelial integrity, approximates the two key immune alterations in HIV infection: CD4(+) T cell immune deficiency and generalized immune activation. We therefore propose activated CD4(+) T cell killing as a common etiology for both immune deficiency and activation in HIV infection.


Figures

Figure 1
Figure 1
Specific targeting of memory and regulatory CD4+ T cells by Tnfrsf4-driven Cre expression. (a) Activated YFP expression in a subset of splenic (SP) and lymph node cells (LN) isolated from Tnfrsf4Cre/+ R26Yfp/+ mice. Numbers within dot plots denote the percentage of YFP+ cells. (b) Percentage (mean ± SEM, n = 6-9) of CD4+, CD8+ or CD19+ cells or cells negative for all three markers (other) in gated YFP+ cells from the spleen and lymph nodes of Tnfrsf4Cre/+R26Yfp/+ mice. (c, d) Percentage (mean ± SEM, n = 6-9) of YFP+ cells in (c) total, naïve (CD44loCD25-), memory (CD44hiCD25-) and regulatory (reg; CD25+) CD4+ T cells and in (d) total, naïve (CD44loCD25-) and memory (CD44hiCD25-) CD8+ T cells, both from the spleen and lymph nodes of Tnfrsf4Cre/+R26Yfp/+ mice. (e) Percentage (mean ± SEM, n = 4-8) of YFP+ cells in naïve, memory and regulatory CD4+ T cells from Tnfrsf4Cre/+ R26Yfp/+ (YFP/+) and Tnfrsf4Cre/+ R26Yfp/Dta (YFP/DTA) mice. (f) Flow cytometric example of YFP and CD134 induction 1 day (d1) after in vitro stimulation of sorted naïve YFP- CD4+ T cells (d0) from Tnfrsf4Cre/+ R26Yfp/+ mice. (g) Percentage of YFP+ and CD134+ cells (mean ± SEM, n = 4-6) in CD4+ T cells stimulated as in (f). (h) Percentage of annexin V+ cells following in vitro activation of sorted naïve CD4+ T cells from Tnfrsf4Cre/+R26Dta/+ (DTA) or control Tnfrsf4Cre/+R26+/+ (WT) mice.
Figure 2
Figure 2
Immunological consequences of DTA-mediated deletion of CD134+CD4+ T cells. (a) Size of inguinal (iLN), axillary (aLN), brachial (bLN), cervical (cLN), mesenteric (mLN) lymph nodes and spleen (SP) from Tnfrsf4Cre/+ R26Dta/+ (DTA) and littermate control Tnfrsf4Cre/+ R26+/+ (WT) mice. (b) Serum levels (mean ± SEM, n = 5-7) of MCP-1, IL-12 (p40), IFN-γ, MIP-1α, IP-10 (CXCL10), IL-1β and MIG (CXCL9) in the same mice. (c) Total numbers of B cells, T cells and macrophages (Mphi). P = 0.02 and P = 0.03 for total cells and B cells, respectively. (d) CD4:CD8 ratio. (e) Total numbers (mean, n = 9-12) of naïve, memory and regulatory (reg) CD4+ T cells and naïve and memory CD8+ T cells. P = 0.0008 for regulatory CD4+ T cells; P = 0.04 for total CD8+ T cells; P = 0.0003 for memory CD8+ T cells. Numbers within bars in (c, e) denote the absolute number, ×10-7 and ×10-6, respectively, of each cell type.
Figure 3
Figure 3
Effect of CD134+CD4+ T cell killing on the phonotype of CD4+ T cells. (a) Naïve, (b) memory and (c) regulatory CD4+ T cell expression of FoxP3 and activation markers, and production of cytokines following in vitro re-stimulation. Numbers within the plots represent the percentage of CD4+ T cells that were positive for each marker. Plots are representative of 4-7 mice per group.
Figure 4
Figure 4
Effect of DTA-mediated deletion of memory and regulatory CD4+ T cells on CD4+ T cell homeostasis. (a) Naïve, (b) memory and (c) regulatory CD4+ T cell BrdU incorporation during a 6-day administration period, and expression of Ki67 nuclear antigen. Numbers within the plots denote the percentage of positive CD4+ T cells and are representative of 4-6 mice per group. P = 0.011 for Ki67 staining in memory CD4+ T cells; P = 0.006 for BrdU incorporation and P = 0.0004 for Ki67 staining in regulatory CD4+ T cells. (d) Loss of BrdU+ naïve, memory or regulatory CD4+ T cells 3 days after cessation of a 6-day BrdU administration period. Values are the percentage (± SEM) of BrdU+ cells in each subset on day 3 after cessation of BrdU administration minus the percentage of BrdU+ cells at the peak (day 6 of the administration period), and are representative of three mice per group. (e) CD45.2+Tnfrsf4Cre/+ R26Dta/+ (DTA) and CD45.1+C57BL/6 (B6) bone marrow (BM) cells were injected separately (single) or mixed together at 1:1 ratio (mixed) into non-irradiated Rag1-/- recipients and lymphoid organs were analyzed 12 weeks later. CD25 and CD44 expression in gated DTA BM-origin or B6 BM-origin CD4+ T cells in these recipients is shown. Numbers within the plots denote the percentage of positive CD4+ T cells and are representative of 4-8 mice per group analyzed in two independent experiments. (f-h) 1 × 10⁶ purified CD4+ T cells from Tnfrsf4Cre/+R26Yfp/+ (YFP/+) or Tnfrsf4Cre/+R26Yfp/Dta (YFP/DTA) mice were adoptively transferred into Rag1-/- recipients and followed over time. (f) Percentage of YFP+ cells in CD4+ T cells in the blood. (g) Percentage of CD4+ T cells in blood mononuclear cells. (h) Total numbers of naïve, memory and regulatory (reg) CD4+ T cells in lymphoid organs at the end of the 7-week observation period. P < 0.0001 for memory CD4+ T cells; P = 0.006 for regulatory CD4+ T cells. Values in (f-h) are the means (± SEM) of five mice per group. Numbers within bars in (h) denote the absolute number, ×10-6, of each cell type. (i) 5 × 10⁶ purified naïve (CD44loCD25-) CD45.1+ CFSE-labeled wild-type CD4+ T cells were adoptively transferred into Tnfrsf4Cre/+R26Dta/+ (DTA host) and control Tnfrsf4Cre/+R26+/+ (WT host) recipient mice. CFSE dilution and CD44 expression on gated CD45.1+ donor CD4+ T cells isolated from the spleens and lymph nodes of recipients 6 days after transfer are shown. Numbers within the plots denote the percentage of CFSE-CD44hiCD4+ T cells and are representative of three mice per group.
Figure 5
Figure 5
Effect of activated CD4+ T cell killing on immune competence. (a) Serum titers (mean ± SEM, n = 5-7) of neutralizing antibodies (nAb) in FV-infected DTA, wild-type (WT) and B6 mice. P ≤ 0.018 and P ≤ 0.007 on days 21 and 28, respectively, between DTA mice and either WT or B6 mice. (b) FV-encoded glyco-Gag on the surface of infected erythroid precursor (Ter119+) cells in the same mice. Glyco-Gag+ Ter119+ cells were detected in four out of seven DTA mice. (c) Serum titers (mean ± SEM, n = 6-9) of nAb in IAV-infected DTA, WT and B6 mice. P = 0.002 between DTA and WT mice and P = 0.00003 between DTA and B6 mice on day 18. (d) Body weight changes in Pneumocystis murina-infected DTA, WT, B6 and MHC II-deficient (MHC II-/-) mice. P ≤ 0.04 between DTA and WT or B6 mice on weeks 16 and 17 after infection for body weight changes. Numbers within the plot denote the ratio of mice tested positive for P. murina at the end of the observation period (P = 0.004 between DTA and control mice).
Figure 6
Figure 6
Effect of DTA-mediated deletion of CD134+CD4+ T cells on CD8+ T cell homeostasis. (a) TNF-α and IFN-γ production and CD62L, CD43 and CD25 expression in gated memory CD44hiCD8+ T cells from Tnfrsf4Cre/+R26Dta/+ (DTA) and littermate control Tnfrsf4Cre/+ R26+/+ (WT) mice (n = 5-12). Cytokine production was assessed following 4-h in vitro stimulation of total spleen and lymph node cells. (b) CFSE dilution profiles of purified naïve (CD44lo) CD45.1+ CFSE-labeled wild-type CD8+ T cells 6 days following adoptive transfer into Tnfrsf4Cre/+ R26Dta/+ (DTA host), control Tnfrsf4Cre/+ R26+/+ (WT host) or lymphopenic Rag1-/- recipient mice (Rag1-/- host). Numbers within the plot represent the mean percentage of CFSE- donor CD8+ T cells in three mice per group. (c) Percentage of BrdU+ cells in memory CD44hiCD8+ T cells and (d) absolute number (mean ± SEM, n = 4) of BrdU+ cells in total CD8+ T cells following a 6-day period of BrdU administration. (e) CD44 and CD25 expression in gated CD8+ T cells of either DTA BM origin or B6 BM origin and (f) CD4:CD8 ratio (± SEM) in Rag1-/- recipients reconstituted with either DTA or CD45.1+ B6 bone marrow (single) or a 1:1 mixture of DTA and CD45.1+ B6 bone marrow (mixed) (n = 4-7).
Figure 7
Figure 7
Influence of microbial exposure on immune homeostasis. (a) Serum LBP levels (mean ± SEM, n = 6-9) in Ikbkgfl/YVil-Cre (NEMO) and littermate control Ikbkgfl/Y(WT) mice. The number above the bars is the P-value. (b) Total numbers (mean, n = 8-9) of B cells, T cells and macrophages (Mphi) in Ikbkgfl/Y Vil-Cre (NEMO) and littermate control Ikbkgfl/Y (WT) mice. P = 0.0007 for macrophages. (c) Flow cytometric example of CD11b+F4/80+ macrophage expansion in the spleen of NEMO mice, compared with WT mice. (d) CD4:CD8 ratio (± SEM) in the same mice. (e) Total numbers of naïve, memory and regulatory (reg) CD4+ T cells and naïve and memory CD8+ T cells from NEMO and control WT mice. (f) Serum LBP levels (mean ± SEM, n = 9-13) in Tnfrsf4Cre/+ R26Dta/+ (DTA) and control Tnfrsf4Cre/+ R26+/+ (WT) mice. (g) Total numbers (mean, n = 4-6) of B cells, T cells and macrophages (Mphi), (h) CD4:CD8 ratio and (i) total numbers of naïve, memory and regulatory (reg) CD4+ T cells and naïve and memory CD8+ T cells in Tnfrsf4Cre/+ R26Dta/+MyD88-/- (DTA) and littermate control Tnfrsf4Cre/+ R26+/+ MyD88-/- (-) mice. P = 0.035 for total cells; P = 0.015 for B cells; P = 0.0003 for regulatory CD4+ T cells; P = 0.018 for total CD8+ T cells; and P = 0.0003 for memory CD8+ T cells. (j) CD62L and CD43 expression in gated memory CD44hiCD8+ T cells from the same mice. Numbers within bars denote the absolute number, ×10-7 in (b, g), and ×10-6 in (e, i), of each cell type.
Figure 8
Figure 8
Restoration of immune homeostasis in Tnfrsf4Cre/+R26Dta/+ mice by regulatory T cells. (a) Expansion of donor-type T cells in the blood of Tnfrsf4Cre/+R26Dta/+ (DTA host) and control Tnfrsf4Cre/+R26+/+ (WT host) recipients of purified regulatory CD45.1+CD25+CD4+ T cells. (b) Expansion and retention of FoxP3 expression in donor CD45.1+CD4+ T cells. Plots show gated CD4+ T cells from lymphoid organs of recipient mice at the end of a 10-week observation period. (c) Percentage of CD44hi(top) and CD62L-CD44hi (bottom) CD8+ T cells in the blood of the same recipients of regulatory CD25+CD4+ T cells. (d) Absolute numbers of CD44hi (top) and CD62L-CD44hi(bottom) CD8+ T cells in lymphoid organs of either DTA and WT mice that did not receive regulatory CD25+CD4+ T cells (-) or DTA and WT mice 10 weeks after transfer of CD25+CD4+ T cells (+ Treg). Values in (a-d) represent the mean (± SEM) of 7-10 mice per group pooled from three independent experiments. (e) Mean serum levels (± SEM) of IFN-γ and MCP-1 in the same mice. Similar results were obtained for IL-12p40, MIP-1α and IL-1β.

Comment in

Similar articles

Cited by

References

    1. Douek DC, Picker LJ, Koup RA. T cell dynamics in HIV-1 infection. Annu Rev Immunol. 2003;21:265–304. doi: 10.1146/annurev.immunol.21.120601.141053. - DOI - PubMed
    1. Giorgi J, Hultin L, McKeating J, Johnson T, Owens B, Jacobson L, Shih R, Lewis J, Wiley D, Phair J, Wolinsky SM, Detels R. Shorter survival in advanced human immunodeficiency virus type 1 infection is more closely associated with T lymphocyte activation than with plasma virus burden or virus chemokine coreceptor usage. J Infect Dis. 1999;179:859–870. doi: 10.1086/314660. - DOI - PubMed
    1. Finkel TH, Tudor-Williams G, Banda NK, Cotton MF, Curiel T, Monks C, Baba TW, Ruprecht RM, Kupfer A. Apoptosis occurs predominantly in bystander cells and not in productively infected cells of HIV- and SIV-infected lymph nodes. Nat Med. 1995;1:129–134. doi: 10.1038/nm0295-129. - DOI - PubMed
    1. Hazenberg MD, Otto SA, van Benthem BH, Roos MT, Coutinho RA, Lange JM, Hamann D, Prins M, Miedema F. Persistent immune activation in HIV-1 infection is associated with progression to AIDS. AIDS. 2003;17:1881–1888. doi: 10.1097/00002030-200309050-00006. - DOI - PubMed
    1. Deeks SG, Kitchen CMR, Liu L, Guo H, Gascon R, Narvaez AB, Hunt P, Martin JN, Kahn JO, Levy J, McGrath MS, Hecht FM. Immune activation set point during early HIV infection predicts subsequent CD4+ T-cell changes independent of viral load. Blood. 2004;104:942–947. doi: 10.1182/blood-2003-09-3333. - DOI - PubMed

Publication types