. 2010 Feb;43(2):232-43.
doi: 10.1016/j.mcn.2009.11.004. Epub 2009 Nov 26.

HIV-1-induced amyloid beta accumulation in brain endothelial cells is attenuated by simvastatin

Affiliations

HIV-1-induced amyloid beta accumulation in brain endothelial cells is attenuated by simvastatin

Ibolya E András et al. Mol Cell Neurosci. 2010 Feb.

Abstract

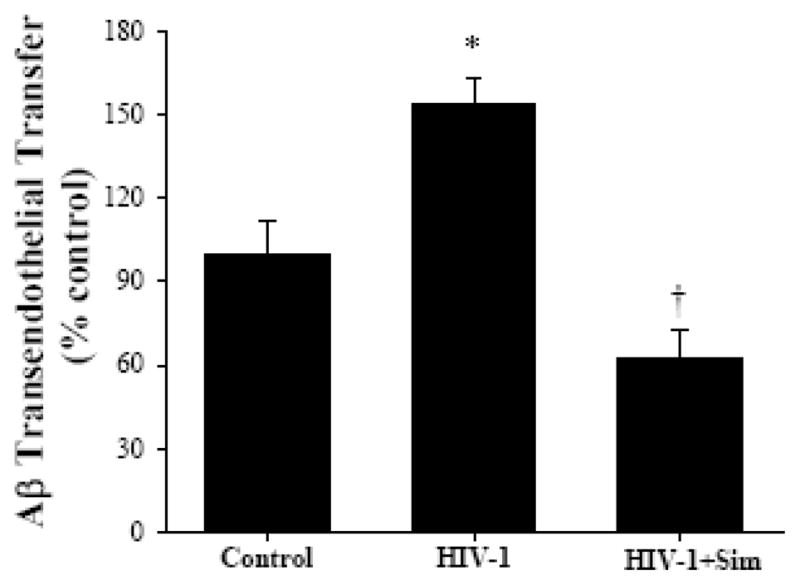
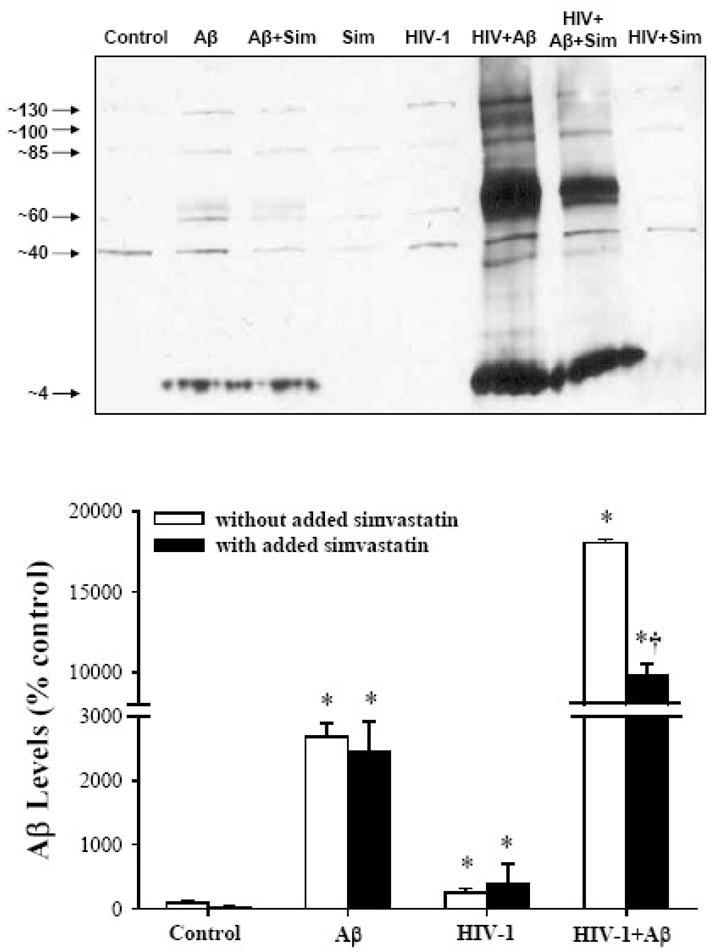
HIV-1-infected brains are characterized by increased amyloid deposition. To study the influence of HIV-1 on amyloid beta (Abeta) homeostasis at the blood-brain barrier (BBB) level, we employed a model of brain microvascular endothelial cells exposed to HIV-1 in the presence or absence of Abeta. HIV-1 markedly increased endogenous Abeta levels and elevated accumulation of exogenous Abeta. Simvastatin, the HMG-CoA reductase inhibitor, blocked these effects. We next evaluated the effects of HIV-1 and/or simvastatin on expression of the receptor for lipoprotein related protein (LRP1) and the receptor for advanced glycation end products (RAGE), known to regulate Abeta transport across the BBB. LRP1 expression was not affected by HIV-1; however, it was increased by simvastatin. Importantly, simvastatin attenuated HIV-1-induced RAGE expression. These results suggest that HIV-1 may directly contribute to Abeta accumulation at the BBB level. In addition, statins may protect against increased Abeta levels associated with HIV-1 infection in the brain.


Figures

Figure 1
Figure 1. Characterization of hCMEC/D3 cells exposed to amyloid beta (Aβ) and HIV-1
The left panel represents a phase-contrast micrograph of a confluent hCMEC/D3 monolayer with the characteristic morphology of fusiform and cobblestone shaped endothelial cells. The right panel confirms that hCMEC/D3 cells exposed to HIV-1 and fluorescent Aβ(1–40) HiLite exhibit immunoreactivity for p24 and diffuse intracellular green fluorescence corresponding to Aβ.
Figure 2
Figure 2. HIV-1 exposure increases accumulation of Aβ in hCMEC/D3 cells
(A) hCMEC/D3 cells cultured in chambered slides were exposed for 24 h to HIV-1 particles at the indicated p24 levels. Aβ levels (red staining) were assessed by immunofluorescence microscopy and DAPI staining was performed to visualize the nuclei (blue staining). (B) Immunoprecipitation followed by western blotting was performed in lysates of hCMEC/D3 cells co-cultured with HIV-1-infected or control U937 cells for 24 h. Mouse antibody against the 1–16 fragment of Aβ was used in these analyses. The blot is the representative image from three independent experiments. The graph represents the combined densitometric measurements of all Aβ immunoreactive bands. (C) hCMEC/D3 cultures were exposed for 24 h to HIV-1 particles at p24 level of 1 ng/ml. Selected cultures were pre-treated with 5 μM simvastatin (Sim) for 5 or 24 h. Aβ and DAPI staining was performed as in (A). In control cultures, endogenous Aβ immunoreactivity exhibited a weak cytoplasmic pattern. A 24h exposure to HIV-1 resulted in a marked increase of Aβ immunoreactivity. Pretreatment with simvastatin for 24 h but not for 5 h appeared to attenuate HIV-1-induced Aβ positive staining. (D) Simvastatin (Sim) inhibits HIV-1-induced transendothelial transfer of Aβ. Confluent hCMEC/D3 cells cultured on Transwell filter inserts were exposed to 1 μM Aβ(1–40) HiLite for 20 min in the presence of HIV-1 (p24 levels, 1 ng/ml) in the upper chamber, modeling the blood site of the BBB. A fluorescence signal of Aβ(1–40) HiLite was measured in the lower chamber, which corresponds to the brain side of the BBB. Selected cultures were pre-exposed to 5 μM simvastatin for 5 h. Values are mean ± SEM, n=3–6. *Significantly different as compared to the control group. †Values in the HIV-1+Sim group are significantly different as compared to cells exposed to HIV-1 alone.
Figure 3
Figure 3. Simvastatin protects against HIV-1-induced accumulation of exogenous Aβ
(A) hCMEC/D3 cells were exposed to HIV-1 particles at p24 levels of 1 ng/ml for 24 h, followed by treatment with 1 μM fluorescently labeled Aβ(1–40) HiLite for the last 10 min of HIV-1 exposure. In addition, selected cultures were pre-exposed to 5 μM simvastatin (Sim) for 5 h or 24 h. Green fluorescence corresponding to Aβ(1–40) HiLite accumulation was assessed by fluorescence microscopy. DAPI staining was performed to visualize the nuclei (blue staining). (B) hCMEC/D3 cells were exposed to HIV-1-infected or control U937 cells for 24 h and/or treated with 1 μM Aβ(1–40) for 10 min. Selected cultures were also exposed to 5 μM simvastatin for 24 h. Cellular levels of Aβ were analyzed by western blotting in whole cell lysates. The blot is the representative image from three independent experiments. The graph represents the combined densitometric measurements of all Aβ immunoreactive bands. Values are mean ± SEM, n=3–4. *Significantly different as compared to the corresponding control group incubated with uninfected monocytes. Values in the group with added simvastatin are statistically different from those without added simvastatin.
Figure 4
Figure 4. Simvastatin increases LRP1 expression
(A) hCMEC/D3 cultures were exposed to HIV-1 and/or simvastatin (Sim) as described in the legend to Figure 2A and LRP1 immunoreactivity was analyzed by immunofluorescence microscopy. In addition, DAPI staining was performed to visualize the nuclei (blue staining). For western blotting, hCMEC/D3 cells were exposed to HIV-1-infected or control U937 cells for 24 h and/or to simvastatin for 5 h (B) or 24 h (C). The blot is the representative image from four independent experiments. The graph represents the quantified combined data from these experiments. Values are mean ± SEM, n=4–7. *Significantly different as compared to the control group incubated with uninfected monocytes.
Figure 5
Figure 5. Simvastatin attenuates HIV-1-induced RAGE expression
(A) hCMEC/D3 cultures were exposed to HIV-1 and/or simvastatin (Sim) as described in the legend to Figure 2A and RAGE immunoreactivity was analyzed by immunofluorescence microscopy. In addition, DAPI staining was performed to visualize the nuclei (blue staining). For western blotting, hCMEC/D3 cells were exposed to HIV-1-infected or control U937 cells for 24 h and/or to simvastatin for 5 h (B) or 24 h (C). The blot is the representative image from four independent experiments. The graph represents the quantified combined data from these experiments. (D) hCMEC/D3 cells were pre-treated with 5 μM simvastatin for 5 h and exposed to HIV-1 particles for 4 h, followed by the determination of RAGE mRNA levels by real-time RT-PCR. Values are mean ± SEM, n=4–7. *Significantly different as compared to the control group incubated with uninfected monocytes. Values in the group with added simvastatin are statistically different from those without added simvastatin.
Figure 6
Figure 6. RAGE is involved in HIV-1-induced Aβ accumulation
hCMEC/D3 cells cultured in chambered slides were exposed to HIV-1 particles for 24 h, followed by treatment with 1 μM fluorescently labeled Aβ(1–40) HiLite for the last 10 min of HIV-1 exposure. In addition, RAGE neutralizing antibody (40 μg/ml) was added to selected cultures for 2 h before termination of HIV-1 exposure. Green fluorescence corresponding to Aβ(1–40) HiLite was assessed by fluorescence microscopy. DAPI staining was performed to visualize the nuclei (blue staining). HIV-1-induced Aβ HiLite accumulation was attenuated by pretreatment with the RAGE neutralizing antibody.
Figure 7
Figure 7. Schematic diagram illustrating the effects of HIV-1 on Aβ accumulation in brain endothelial cells
Exposure to HIV-1 results in RAGE overexpression, which stimulates the transfer of Aβ from the blood into the brain. Simvastatin (Sim) protects against these effects. Exposure to Sim also enhances expression of LRP1, which transports Aβ from the brain into the bloodstream. Treatment with HIV-1 alone does not affect LRP1 expression.

Similar articles

Cited by

References

    1. Achim CL, Adame A, Dumaop W, Everall IP, Masliah E. Increased accumulation of intraneuronal amyloid beta in HIV-infected patients. J Neuroimmune Pharmacol. 2009;4:190–199. - PMC - PubMed
    1. Andras IE, Rha G, Huang W, Eum S, Couraud PO, Romero IA, Hennig B, Toborek M. Simvastatin protects against amyloid beta and HIV-1 Tat-induced promoter activities of inflammatory genes in brain endothelial cells. Mol Pharmacol. 2008;73:1424–1433. - PMC - PubMed
    1. Bhaskaran K, Mussini C, Antinori A, Walker AS, Dorrucci M, Sabin C, Phillips A, Porter K. Changes in the incidence and predictors of human immunodeficiency virus-associated dementia in the era of highly active antiretroviral therapy. Ann Neurol. 2008;63:213–221. - PubMed
    1. Blanc EM, Toborek M, Mark RJ, Hennig B, Mattson MP. Amyloid beta-peptide induces cell monolayer albumin permeability, impairs glucose transport, and induces apoptosis in vascular endothelial cells. J Neurochem. 1997;68:1870–1881. - PubMed
    1. Brew BJ, Crowe SM, Landay A, Cysique LA, Guillemin G. Neurodegeneration and ageing in the HAART era. J Neuroimmune Pharmacol. 2009;4:163–174. - PubMed

Publication types

MeSH terms

Substances